17 Last-Mile Delivery Metrics You Need to Track in 2024

Delivery software has addressed many challenges for couriers—one of the most significant is helping operations managers track last mile delivery metrics to drive revenue growth.
We surveyed last-mile delivery companies to find out what key performance indicators (KPIs) are used the most by successful dispatch teams in 2024, and these are the results of those findings:
17 last-mile delivery KPIs & metrics for success
Here are the most critical last-mile delivery metrics as outlined by logistics managers and dispatchers:
1. On-Time Delivery Rate:
Here’s a simple question: Are your customers receiving their orders on time? The quality of the customer experience with your business is arguably most impacted by the delivery process.
On-time delivery (OTD) rates measure the efficiency of your last mile delivery operation. Logistics and operations managers use OTD rates to evaluate the effectiveness of their courier service, identify inefficiencies, and make tweaks to help client recipients receive shipments on time.
Keep in mind that there’s no hard and fast rule for defining what on-time delivery means for your business compared to other businesses in your industry. What matters is the promise you make to your customers when they complete a purchase. For example, if you promise same-day delivery by 5pm, then even one minute after 5pm is considered a late delivery—souring the customer experience and harming your brand reputation.
Here’s how to calculate your OTD rate:

Why is the OTD KPI important?
An effective courier delivery business should have an OTD rate as close to 100% as possible. Obviously, a perfect OTD rate is next to impossible due to the unpredictable nature of last mile delivery – but close is pretty good!
An OTD rate averaging between 90% and 100% strongly reflects the effectiveness of your business model, meaning customers can place their trust in your brand. If your couriers continuously run late, it sours the customer experience. Think about it—they won’t buy from you again if they believe your delivery service is unreliable. According to Ipsos, up to 85% of online shoppers won’t buy from a retailer again due to a poor delivery experience.
Example: early deliveries also disrupt your OTD rate
Missed deliveries, reattempts, and lost deliveries decrease your OTD rate, and it’s natural to assume late deliveries are just as much of a lag on your OTD rate performance—which is true. However, many courier businesses fail to consider just how badly early deliveries can sour the customer experience.
Now, you might think: wait a minute, aren’t early deliveries a good thing? Not for the customer who plans their daily schedule around the pre-arranged delivery window.
Suppose your customer has been told that they can expect a package to arrive between the hours of 10am, and 12pm. What if the customer stepped out to run some early morning errands before the scheduled delivery time? Your driver arrives at 9:30am, and the customer isn’t home to accept the package. Suddenly, your early delivery results in a missed delivery, a notch against your OTD rate, and a very dissatisfied customer—who must now go through the whole process all over again.
2. First attempt delivery success rate
Obviously, the more often customers successfully receive their orders in the first delivery attempt, the more satisfied they are with your business. That’s why it’s important to measure the first attempt delivery success rate among all your courier drivers.
Calculating your first attempt delivery success rate is fairly straightforward. Take the number of successful first deliveries and divide by your total number of deliveries, then multiply by 100. For example, if you sent out 100 deliveries and 85 were successfully delivered on the first attempt, your first attempt delivery success rate is 85%.
Why is this last-mile delivery metric significant?
Every delivery costs your business time and money. By increasing your first attempt delivery success rate, you reduce the number of additional scheduled deliveries to the customer's doorstep—ultimately improving the bottom line of your business.
Harvard Business Review states that up to 20% of online orders aren’t delivered on the first attempt. Therefore, if you can keep your first attempt delivery success rate above the 80% benchmark, your delivery system is performing in the upper threshold of all courier providers—in a manner that keeps costs in line.
Example: measure the first attempt delivery success rate for each courier

Using last mile delivery software like Circuit for Teams, you can measure the first attempt delivery success rate for each individual driver. The dashboard above shows, on the left, the total number of successful delivery attempts by your couriers in a fixed period of time—a week, in this instance. On the right, the dashboard calculates the first attempt delivery success rate for each driver in the same period of time. Use this data to evaluate performance and make any changes to your current delivery operation, where necessary.
3. Failed/missed delivery rate
This one is fairly easy to understand. If your couriers are failing to complete deliveries, customers won’t be happy, and they won’t order from you again.
Your goal should be to keep your failed or missed delivery rate as close to zero as you can get. A perfect zero percent rate is possible, but not probable. There are factors that are beyond your control, no matter how well you plan out the routes for your couriers.
Why does this KPI matter?
Without a dashboard tracking your failed or missed delivery rates, you don’t have data that documents the trend of incomplete customer deliveries. Maintaining records of this information as a KPI helps improve your business.
If missed deliveries are part of a widespread problem with most or all of your couriers, you can invest in new delivery route planning solutions to improve team performance and accountability. If the data shows that the highest percentage of missed deliveries are caused by one or two couriers, you can step in and provide additional coaching or training to course-correct the issue with those drivers.
Example: use your missed delivery rate to improve performance
Using a system like Circuit for Teams, you can measure your missed delivery rate using the built-in dashboards. You can use the dashboard to measure each courier’s successful and missed deliveries. The data gives you clarity into the underlying issue so that you can implement a solution that improves performance. If you don’t have the data, you’re not getting to the heart of the matter.

Within your Circuit for Teams account, you have access to a dashboard that includes a daily analytics snapshot of all your delivery analytics—including failed or missed deliveries. You can view historic data from 90 days and as far back as a year, depending on your plan. Set your timeline filters and simply click the ‘Export data’ button to generate reports on your core delivery metrics.
As for the failed delivery attempt metrics, the dashboard generates three levels of data that you can evaluate:
- All time total
- Daily average
- Average per driver
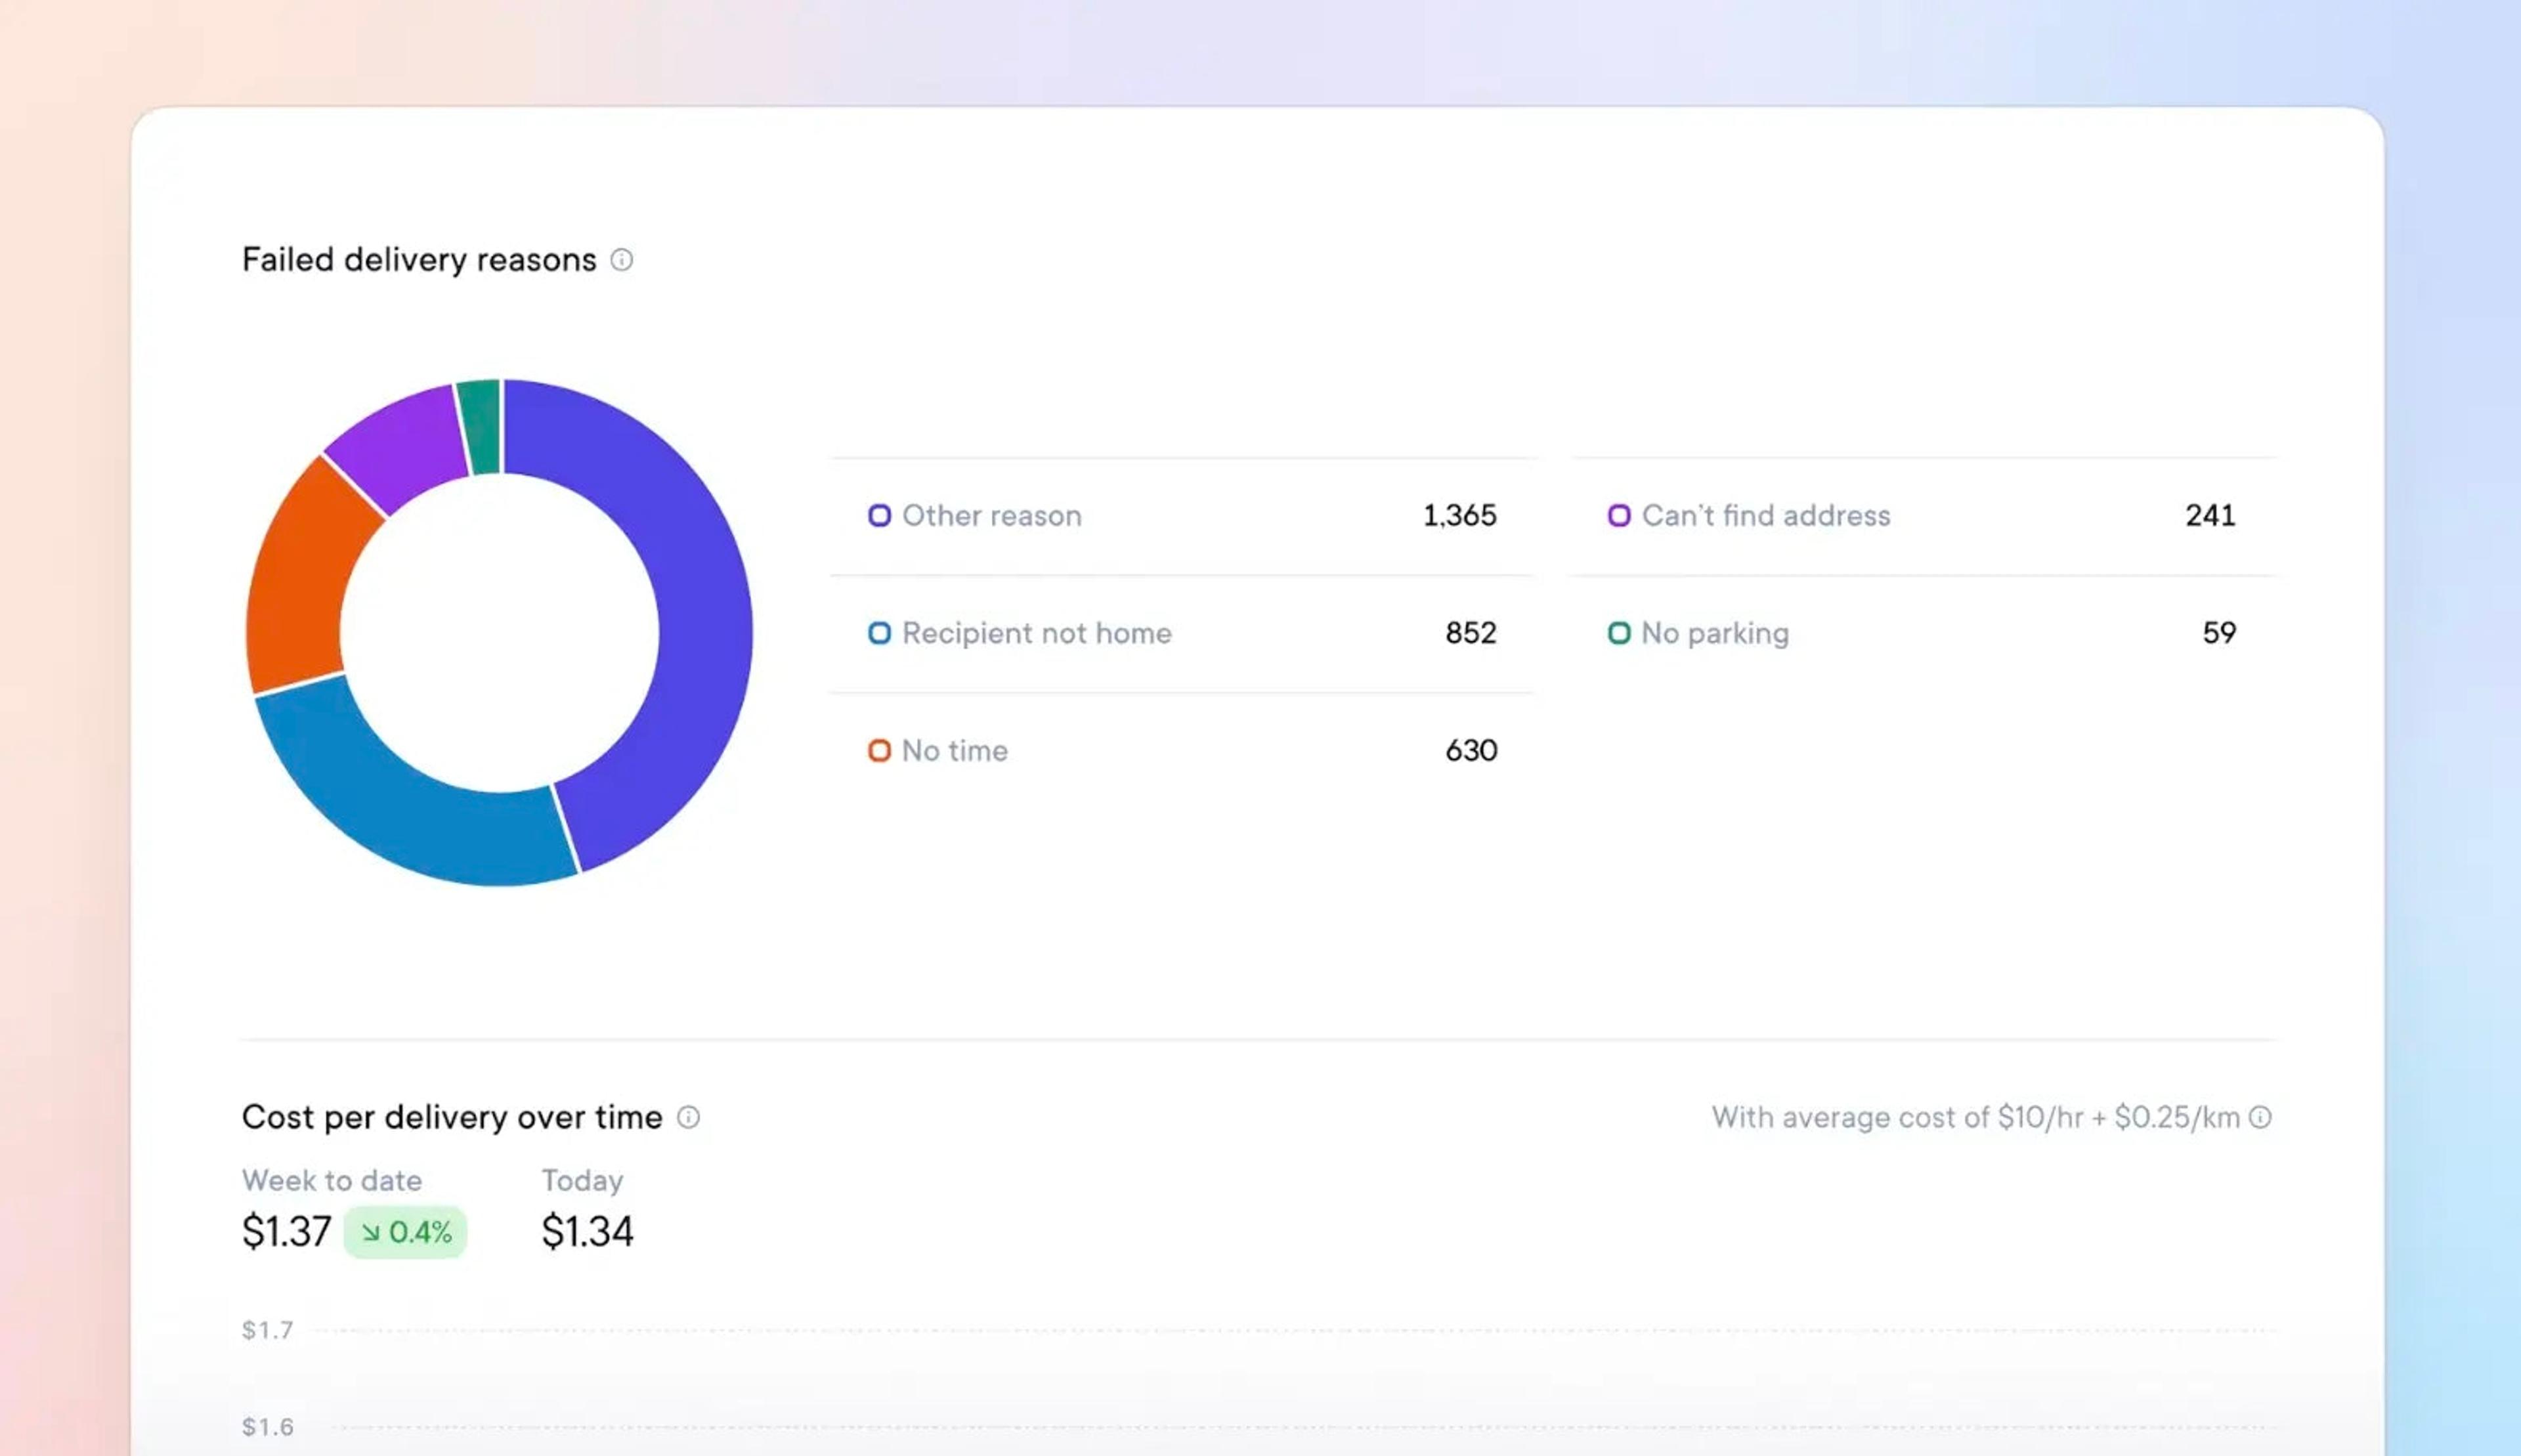
You can also use a second dashboard to evaluate the common reasons responsible for the failed deliveries. Circuit for Teams categorizes the most common reasons—such as ‘recipient not home’, ‘can’t find address’, ‘no parking’, etc. As logistics and operations managers, these last-mile delivery metrics help you determine the best way to improve your delivery process.
4. Customer Satisfaction Score (CSAT):
You’ve seen the argument about the customer experience multiple times in this post, and there’s a good reason for it. The customer experience determines whether one-time buyers will become repeat customers, and customer satisfaction scores (CSATs) provide data-backed sentiment as to how customers feel about their buying experience with your client's brand. This is especially crucial for e-commerce businesses, where fast and reliable delivery is often a deciding factor for customer loyalty.
Why are CSATs an important last-mile delivery metric?
CSATs measure feedback and ratings provided by customers post-delivery. CSATs can be quantified as a score in a post-delivery survey, or qualified through written feedback provided by the recipient once the delivery is complete. Either format gives you proven insight into how customers think and feel about the delivery experience, which helps solidify their perceptions towards your brand.
Example: customers tell you their perspective on what’s working and what’s not
No matter how well-managed your courier dispatch system is, there are always ways to improve the experience. What makes CSATs such an invaluable last-mile delivery metric is that they’re the best example of customer feedback. They’re telling you exactly what they like or don’t like about your delivery experiences. You can’t evaluate your business model any better than through CSAT scores.
Tracking Customer Satisfaction Score (CSAT) gives us direct feedback from our customers. Their ratings and comments help us pinpoint areas for improvement and ensure we’re meeting their expectations, which is crucial for our success

Sagar Bhat
Owner of Shoot Delivery, courier service with 50+ drivers
5. Cost per Delivery
The goal of any courier business is to maximize your margins on each delivery, and the best way to increase profitability is to reduce your cost per delivery. Traditionally, it’s been difficult to calculate specific costs per delivery because there are so many variables that impact the total cost.
Why is cost per delivery an important KPI?
Using Circuit for Teams, you now have the option to set a custom cost per delivery to calculate the cost per hour or the cost per mile for each of your deliveries.
These specific metrics help you measure other costs that impact the delivery, such as fuel, labor, and other operating expenses. This gives you an accurate assessment of your ongoing business expenses. Use this data to make financially logical decisions that help lower your cost per delivery and increase your operating margins.
Example: identify cost per delivery by vehicle type

This is where you can really shine as a logistics and operations manager. Using your Circuit for Teams account, you can easily calculate your cost per delivery on a vehicle by vehicle basis.
Costs will vary depending on the vehicle. For example, larger trucks will burn through more fuel than smaller vehicles, which increases the cost per delivery issued by those larger trucks. Having access to this valuable data makes it easier to justify major changes to the business model, such as changing your fleet of delivery vehicles for specific jobs. Show the numbers and build your case!
6. Estimated VS actual route duration
Sticking with the cost per delivery theme, one of the largest cost contributors is the delivery route itself. As logistics and operations managers, you can estimate how long drivers should take to complete a specific route. More often than not, though, those estimations don’t reflect the actual route duration time.
With online spending surpassing $6 billion annually—representing one fifth of global retail sales—it’s critical for courier businesses to have accurate route estimations and make their deliveries on time.
Why actual route durations are critical last-mile delivery KPIs
Understanding the difference between your estimated vs. actual route duration times helps you allocate driver resources more accurately over time, and improves the quality of the delivery experience for your client’s recipients. If your estimated route durations are significantly shorter than the actual route duration times, you may be underutilizing your resources and not operating at full capacity.
When your estimated route durations are too short compared to reality, you may assume that your vehicles and workforce can handle more deliveries than they actually can within a given time frame. This can lead to several issues:
- Unfinished routes: If a driver can’t complete the planned route because it’s too ambitious, they might end up returning with tasks undone.
- Idle time between shifts: Overly optimistic estimates could cause you to plan fewer shifts or vehicles than necessary, assuming your workers will complete more deliveries faster.
- Resource mismatch: If your estimated durations are too short, you might plan for fewer workers or vehicles, thinking they can handle the workload.
With fewer drivers available throughout the day—because your estimations aren’t accurately reflecting the route durations—you won’t have enough drivers to keep up with order demand. As a result, your late or missed deliveries will rise, and customers will miss the deliveries they expect to receive—impacting your OTD rate, as well as bringing down your CSAT and sentiment scores.
Example: use past analytics to make accurate future estimations

Circuit for Teams provides a dashboard that gives a side-by-side comparison between estimated and actual route durations. You can use your recent analytics report and compare the actual route duration time with the average route duration time. Using this data, you can see how much the average route duration differs from your estimated route durations—providing hard, concrete data to modify how you forecast future route timings, all thanks to automated data collection.
Generating these reports is a simple process. In your Circuit for Teams dashboard, go to Settings, select Analytics, and run the “Route duration compared to estimate” report. The results will appear on your dashboard so you can begin your analysis.
Your route data is also automatically collected and stored, allowing you to build an increasingly accurate picture over time with historical insights.
7. Average service time (AST)
Average service time (AST) measures the time you spend on individual orders. Keep in mind that this doesn’t just include the time it takes to deliver the order to the customer. Your AST factors in the whole delivery sequence, beginning with:
- The moment that the dispatch for the package is issued
- The time it takes for the driver to get to the warehouse
- How long it takes to fill out the order paperwork
- Time it takes to collect the package and load it onto the truck
- The actual route duration from the warehouse to the customer’s home
Why is AST an important last-mile delivery metric?
Your drivers are likely running multiple deliveries per day, which is why knowing your AST is so essential. By knowing the average amount of time it takes for each driver to complete the entire delivery sequence, you can adjust dispatches and improve your capacity to deliver packages on time—and shorten your delivery routes.
To calculate your AST, take the total amount of time in a courier’s delivery sequence and divide it by the number of stops or deliveries made on the route. The result breaks down the average amount of time it takes for each courier to complete their daily deliveries.
Example: automatically calculate AST and save valuable time
Circuit for Teams automatically updates your AST, making it faster and easier to analyze the length of time it takes to complete a typical delivery. By comparing ASTs on a driver-by-driver basis, you can set benchmarks and encourage each courier to hit those benchmarks. This will improve workforce productivity and efficiency, while also helping more customers receive their orders on time.
8. Delivery cost per package
We’ve already discussed how to calculate the cost per delivery—a process made much easier using courier management software like Circuit for Teams. You can go one step further by calculating the delivery cost per package using delivery analytics.
Why is this an important last-mile delivery KPI?
The key with this metric is that it considers the additional costs for each delivery. This includes fuel costs, labor costs, and any operating expenses incurred during the delivery process. It gives you a more accurate picture of how much you’re spending to deliver each package to your customers.
9. Response time
The last mile delivery process requires a great deal of customer engagement. People pay close attention to their delivery statuses—in fact, over 90% of online shoppers actively track their packages.
Sometimes, shoppers have questions or disputes about the delivery experience. As last-mile delivery providers, your ability to respond to those questions and concerns impacts the quality of the customer experience.
Example: unforeseen delivery challenges upend your planned schedule
It’s not just your client’s recipients who ask questions in real-time. In many cases, your clients themselves will also want to know the details of a specific delivery dispute or order.
As last-mile delivery logistics managers, your ability to adapt and respond to any unforeseen circumstances determines the quality of your delivery experiences. You can use live tracking features to track your drivers in real-time and reorganize deliveries at the touch of a button to adjust when road conditions derail your plans.
The client portal also allows your clients and their recipients to log in and check the details and ETA of a specific delivery, which helps to reduce those back-and-forth delivery disputes.
10. Order Accuracy
This is a fairly self-explanatory metric—customers don’t want to receive the wrong package, or have a missing package in their delivery. If they do, you can expect your CSAT score as a courier business to take a hit.
It’s fairly easy to calculate your order accuracy rate. Take the number of accurately delivered orders and divide that number by the total number of deliveries, then multiply by 100.
Why is this last mile delivery metric important?
There’s an industry standard that companies should aspire towards. Most DTC retailers aim for order accuracy rates above 95%. Lower order accuracy rates reduce customer satisfaction, which can terminate relationships with previously loyal buyers.
11. Fuel consumption rate (FCR)
This one is a harder metric to calculate, but it’s still very important to do so. You can potentially save a lot of money and improve your delivery workflow.
To calculate your fuel consumption rate (FCR), divide the total distance driven on your couriers’ delivery routes by the gas they’ve each consumed. You can use one of these recommended gas calculators to increase your understanding of your fleet’s fuel consumption costs.
Why is this FCR an important KPI?
The purpose of this KPI is to figure out how much fuel you’re wasting. If you know how much you’re spending on fuel per vehicle for each delivery route, you can figure out the best way to cut those fuel costs without disrupting your operations. This will help you increase the margins on each delivery, which ultimately makes your business model more profitable.
Example: have your drivers calculate FCRs
As logistics and operations managers, you can actually delegate the responsibility for tracking this metric onto your couriers. Here’s how to do it.
- Have your drivers wait until the tank is almost empty before filling up again
- Tell them to take down how much fuel it took to fill up
- Reset the odometer as they begin a new leg of their delivery route
- Wait until they get down to empty again
- Divide the distance they travelled by the amount of fuel put in the vehicle.
- Submit that number as their FCR
12. Cost per mile
Any metrics that evaluate costs are actually opportunities. For every amount of money you can save on your operating expenses, that’s money you’re putting back into the business budget. Think of how much you’ll look like a hero for every cost you can bring down.
Cost per mile is a simple metric to calculate. Add up all the expenses that a courier incurred over a specific period, and divide them by the total number of miles driven over that timeframe.
Why is this an important last-mile delivery KPI?
This is one of the best ways to report all expenses related to each delivery. This includes costs such as:
- Repairs
- Insurance
- Car washes
- Gas fill-ups
- Toll fees
- Etc.
The more you understand where the money is going on each delivery, the more you can rein those costs in and figure out ways to bring them down. Then, who knows, you may even find a few extra bucks to make the next office party a real wild time!
13. Total mileage
This is probably the most straightforward metric on the list. You want to add up the total mileage that each driver traveled while making deliveries. This metric is actually essential to calculating some of your other important metrics, such as cost per mile, FCR, and actual route duration.
Example: use route optimization software to reduce total mileage
Using route optimization software, you can easily optimize your route plans and drastically reduce costs incurred over the course of each of those routes. It’s an efficient way to trim unnecessary costs and put more money back into the operating budget.
14. Percentage of late stops
Obviously, your goal should be to have as few late stops as possible. Similar to your failed delivery KPI, a perfect zero is unlikely because there are environmental factors beyond your control—no matter how well you plan out your delivery routes.
Why does this last mile delivery KPI matter?
If you know the percentage of deliveries that do report late stops, you can figure out if there’s a more in-depth problem with how your delivery system is managed. Your analytics reports can help you monitor the percentage of late stops, and determine what lies at the root cause for those delays.
Once you know what lies at the root cause, you can address the issue and make it right. This is how you’ll keep your customers happy and satisfied—by doing everything in your power to keep as many orders as close to the estimated time of arrival as possible.
15. Damage claims
Shipping damage happens. There are some packages that are extremely fragile and, no matter how much your couriers take extra precautions to protect those packages, there are some occasions when no amount of added effort will be enough to stop damage.
However, as logistics and operations managers, it’s important to know the frequency that damages occur, and the claims that customers submit against your business for those damages. This is another example of using data to manage your operating budget, and find opportunities to bring your costs down.
Why are damage claims relevant to last-mile delivery KPIs?
Customer expectations have changed as quickly as the rise in online shopping orders. People expect their orders and the packaging that contains them to be in pristine condition, no matter the circumstances. A perfect delivery run with absolutely zero damage claims is unlikely, but you can monitor the trend of damage claims made by customers against your business. Knowing this information will give you a better idea if a deeper problem exists.
Example: help drivers prevent shipping damages
So what can you do to keep more packages from being damaged? Use these four tips to help your delivery drivers protect and preserve your customers’ orders so that you can protect and preserve your brand reputation.
- Identify fragile shipping labels and take extra care with those packages
- Make sure your drivers pack the truck correctly, so those fragile packages are safe
- Properly secure the packages to prevent items from moving improperly
- Encourage all couriers to drive safely and respect the rules of the road
16. Capacity Utilization
Are you economizing all the available space in your delivery vehicles? If you don’t know for sure, then you need to calculate your capacity utilization.
Why is capacity utilization important for last-mile delivery businesses?
Capacity utilization measures the efficiency of how much each delivery vehicle is being used. It can be measured in either volume, weight, or available space inside the vehicle.
As operations managers, it’s your responsibility to capitalize on the available space in each of your delivery vehicles. Your capacity utilization rate gives you insight into how your vehicles are being used, and you can then look for ways to improve efficiencies—potentially by removing the need for one or more vehicles on the road, which generates massive savings in operating expenses.
17. Delivery Time Window Compliance
Finally, to complete your list of important last-mile delivery metrics, the final metric on the list is your delivery time window compliance rate. This measures the percentage of deliveries made within the specified time window chosen by the customer.
Each time a customer orders a product from your business, they’re entering into an agreement. That agreement stipulates that they will pay for the product, plus the shipping fees, in exchange for a reasonable delivery in a pre-determined window of time.
Why is delivery time window compliance so important for last-mile delivery businesses?
The agreement that’s entered into with each customer must be upheld by your couriers. Failure to remain in compliance with those terms will result in dissatisfied customers, many of whom will not be shy about vocalizing their disappointment in your business—often through very notable social media posts.
In some cases, customers may even bring legal action against your company if a delivery service is particularly awful. Therefore, abiding by the agreed-upon terms and maintaining the delivery time window compliance is the best way to preserve your brand reputation and retain loyal customers.
Example: take advice from the owner of Shoot Delivery
We like to track deliveries made within the customer's chosen time window because it is a direct barometer of how we're meeting their expectations. This metric has been crucial for us. By focusing on it, we’ve noticed a real uptick in customer satisfaction. People appreciate knowing exactly when their delivery will arrive, and hitting those time windows consistently has built trust and loyalty. It’s not just about getting packages there quickly – it’s about being reliable and respecting our customers' time.
Sagar Bhat
Owner of Shoot Delivery, courier service with 50+ drivers
Circuit for Teams: last-mile delivery metrics made easy

Circuit for Teams is a delivery management software that includes features that can turn last-mile delivery operations from a nightmare into an efficient revenue driver. It offers a synced dispatcher dashboard and driver app, route planning, route optimization, customer notifications, proof of delivery and live driver tracking.
Plus, our delivery analytics dashboard is comprehensive and effortless to use. It includes exportable reports that give you valuable insights to alleviate bottlenecks and have the greatest impact on your business.
These are some of the most common types of reports you can generate using Circuit for Teams. They include reports such as:
- Attempted volume
- Stop type
- Successful attempts
- Success rate
- Failed attempts
- Failure rate
- Percentage of late stops
- Average lateness
- Failed delivery reasons
- Cost per delivery over time
- Route duration compared to estimate
- And much more
Additionally, you can apply specific filters to look for very specific metrics when evaluating each practical business case. All reports can be filtered by:
- Team
- Individual driver
- Day
- Week
- Month
- Quarter
- Year
- Last 7 days/4 weeks/3 months/ 12 months
- All time
- Custom time periods
Note: Tracking last-mile delivery metrics is simple with the Circuit for Teams analytics dashboard—but that’s just one way the software helps save your courier business money. Circuit for Teams also optimizes routes, sends delivery notifications, and collects proof of delivery, making your operations more efficient across the board.Try it free for 7 days and see the impact on your bottom line.
Last-mile delivery metrics FAQs
What is a KPI for last-mile delivery?
The most valuable ways to use your last-mile delivery KPIs are by monitoring order accuracy, on-time deliveries, and customer happiness. Together, these last-mile delivery KPIs have the most profound impact on customer satisfaction, which influences customer retention and reorder rates. Maintaining high levels of customer satisfaction is the best way to build a sustainably loyal base of happy repeat customers.
TLDR: What are the top five last-mile delivery metrics?
In our opinion, it’s difficult to look past these five key metrics.
- First attempt delivery success rate
- On-time delivery (OTD) rates
- Cost per delivery
- Actual route duration
- Customer satisfaction (CSAT) scores
If nothing else, you should make sure these metrics are as strong as they can be. If you’re successful at keeping these metrics in solid form, you’re running a very effective last-mile delivery business.
How do I optimize my last-mile delivery?
The best way to optimize your delivery schedules and improve last-mile delivery metrics is to use delivery management software. Systems like Circuit for Teams are designed to optimize last mile delivery operations and turn your courier delivery system into a revenue-generating operation. Circuit for Teams provides a powerful delivery analytics dashboard that simplifies decision-making, helping you drive better results for your business.
How to calculate last-mile delivery efficiency?
There’s no one simple metric that applies to all last-mile delivery scenarios. However, there are a handful of ways you can address last-mile delivery issues in your supply chain. These are some of the most important components of any last-mile delivery optimization program.
- Improve the time it takes to receive, load, and ship orders from your warehouse
- Invest in technology—such as delivery management software
- Optimize your delivery routes using dynamic vehicle routing
- Establish channels to enable real-time customer communications
- Implement an effective real-time delivery tracking system