Manage Delivery

Track live activity
and resolve issues

Manage your team, routes, and disputes in real time. Use live feedback to increase successful stops.

A split-screen dashboard showing a left sidebar with “Overview › Today Morning Route,” a search box, and two drivers (Esther Howard and Trevor Philipps) with their next stops and times, alongside a main map of the Bronx displaying three colored delivery routes (blue, teal, orange) radiating from a central depot icon with stops labelled, plus zoom controls and a “Create new route” button.

12%

reduction in overall delivery costs

3h

less time spent planning routes

We love Circuit. An intuitive app for our drivers is crucial when making sure that deliveries are handled correctly.

Sagar BhatFounder of Shoot Delivery • Canada

Track

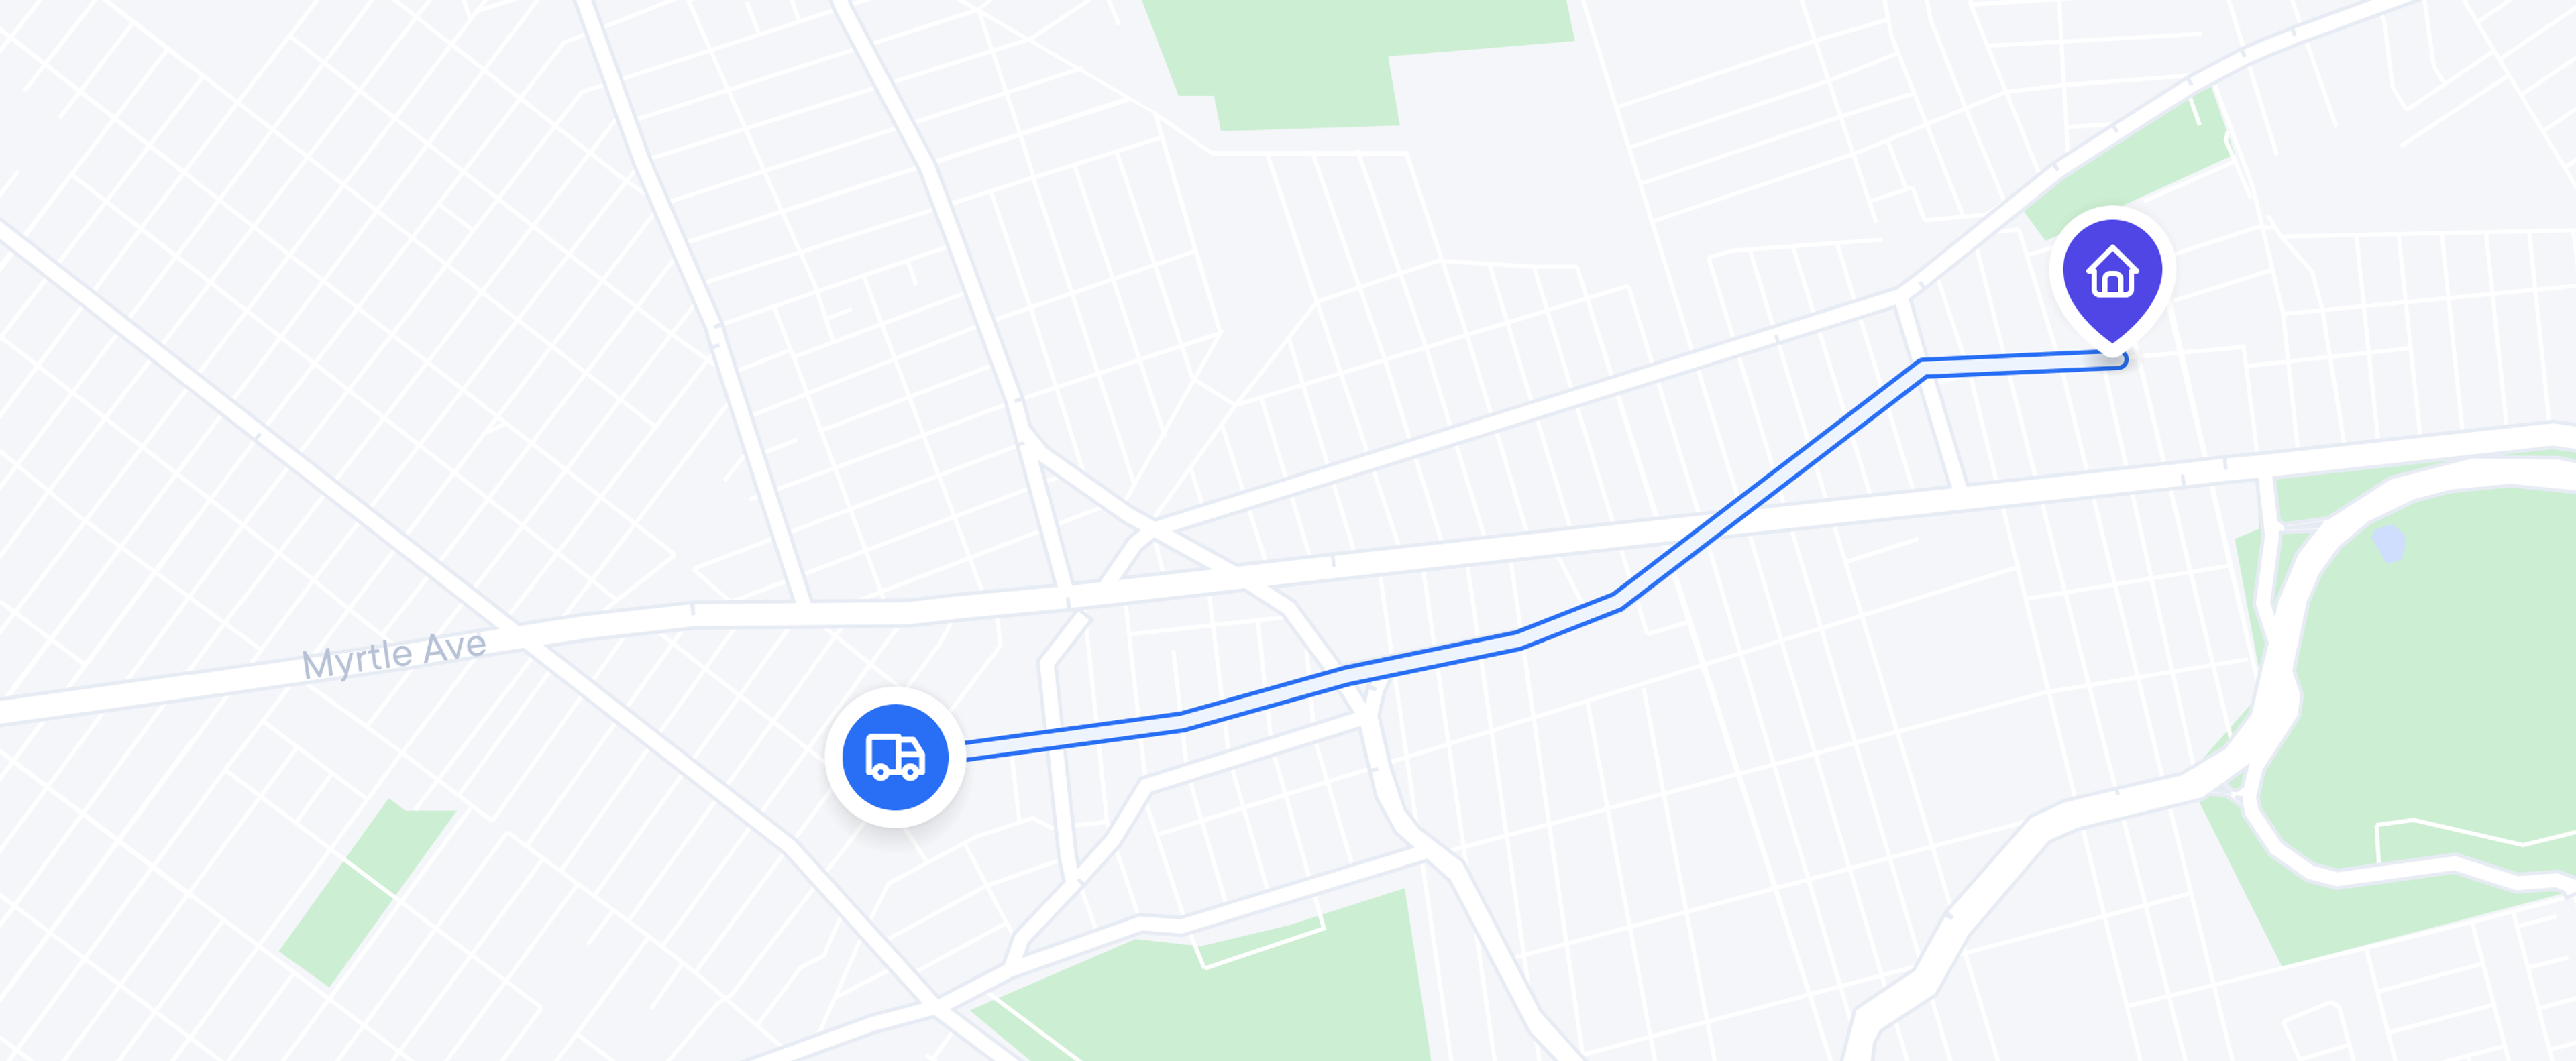
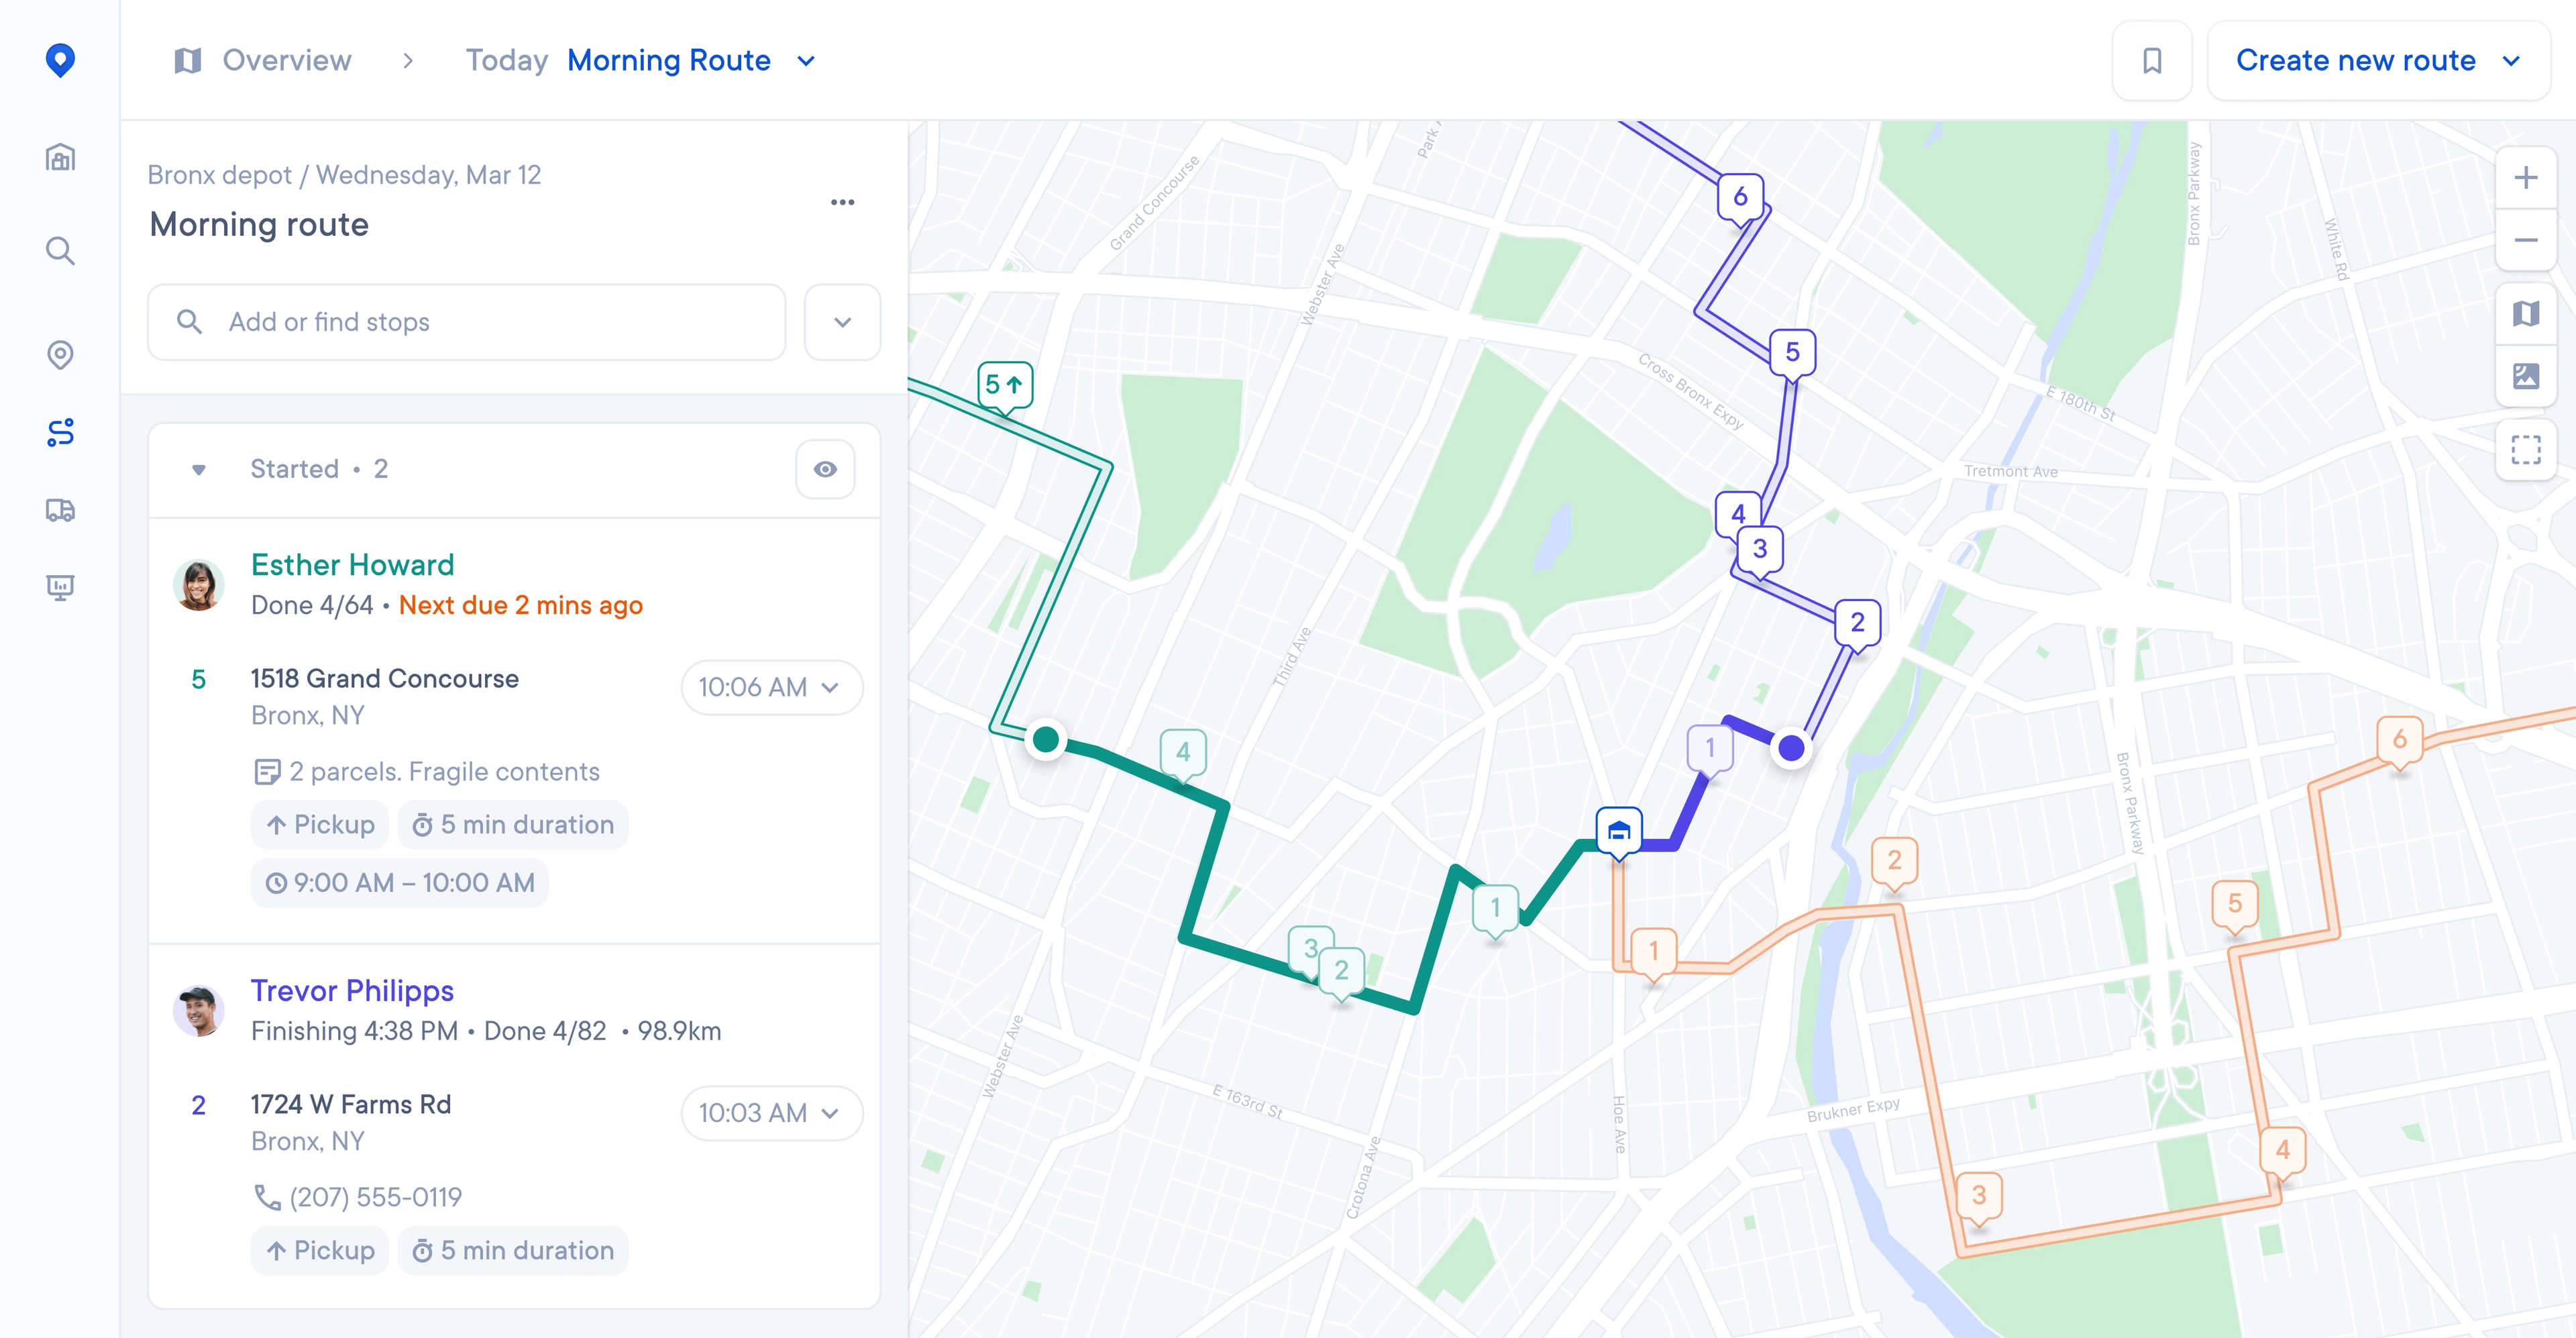
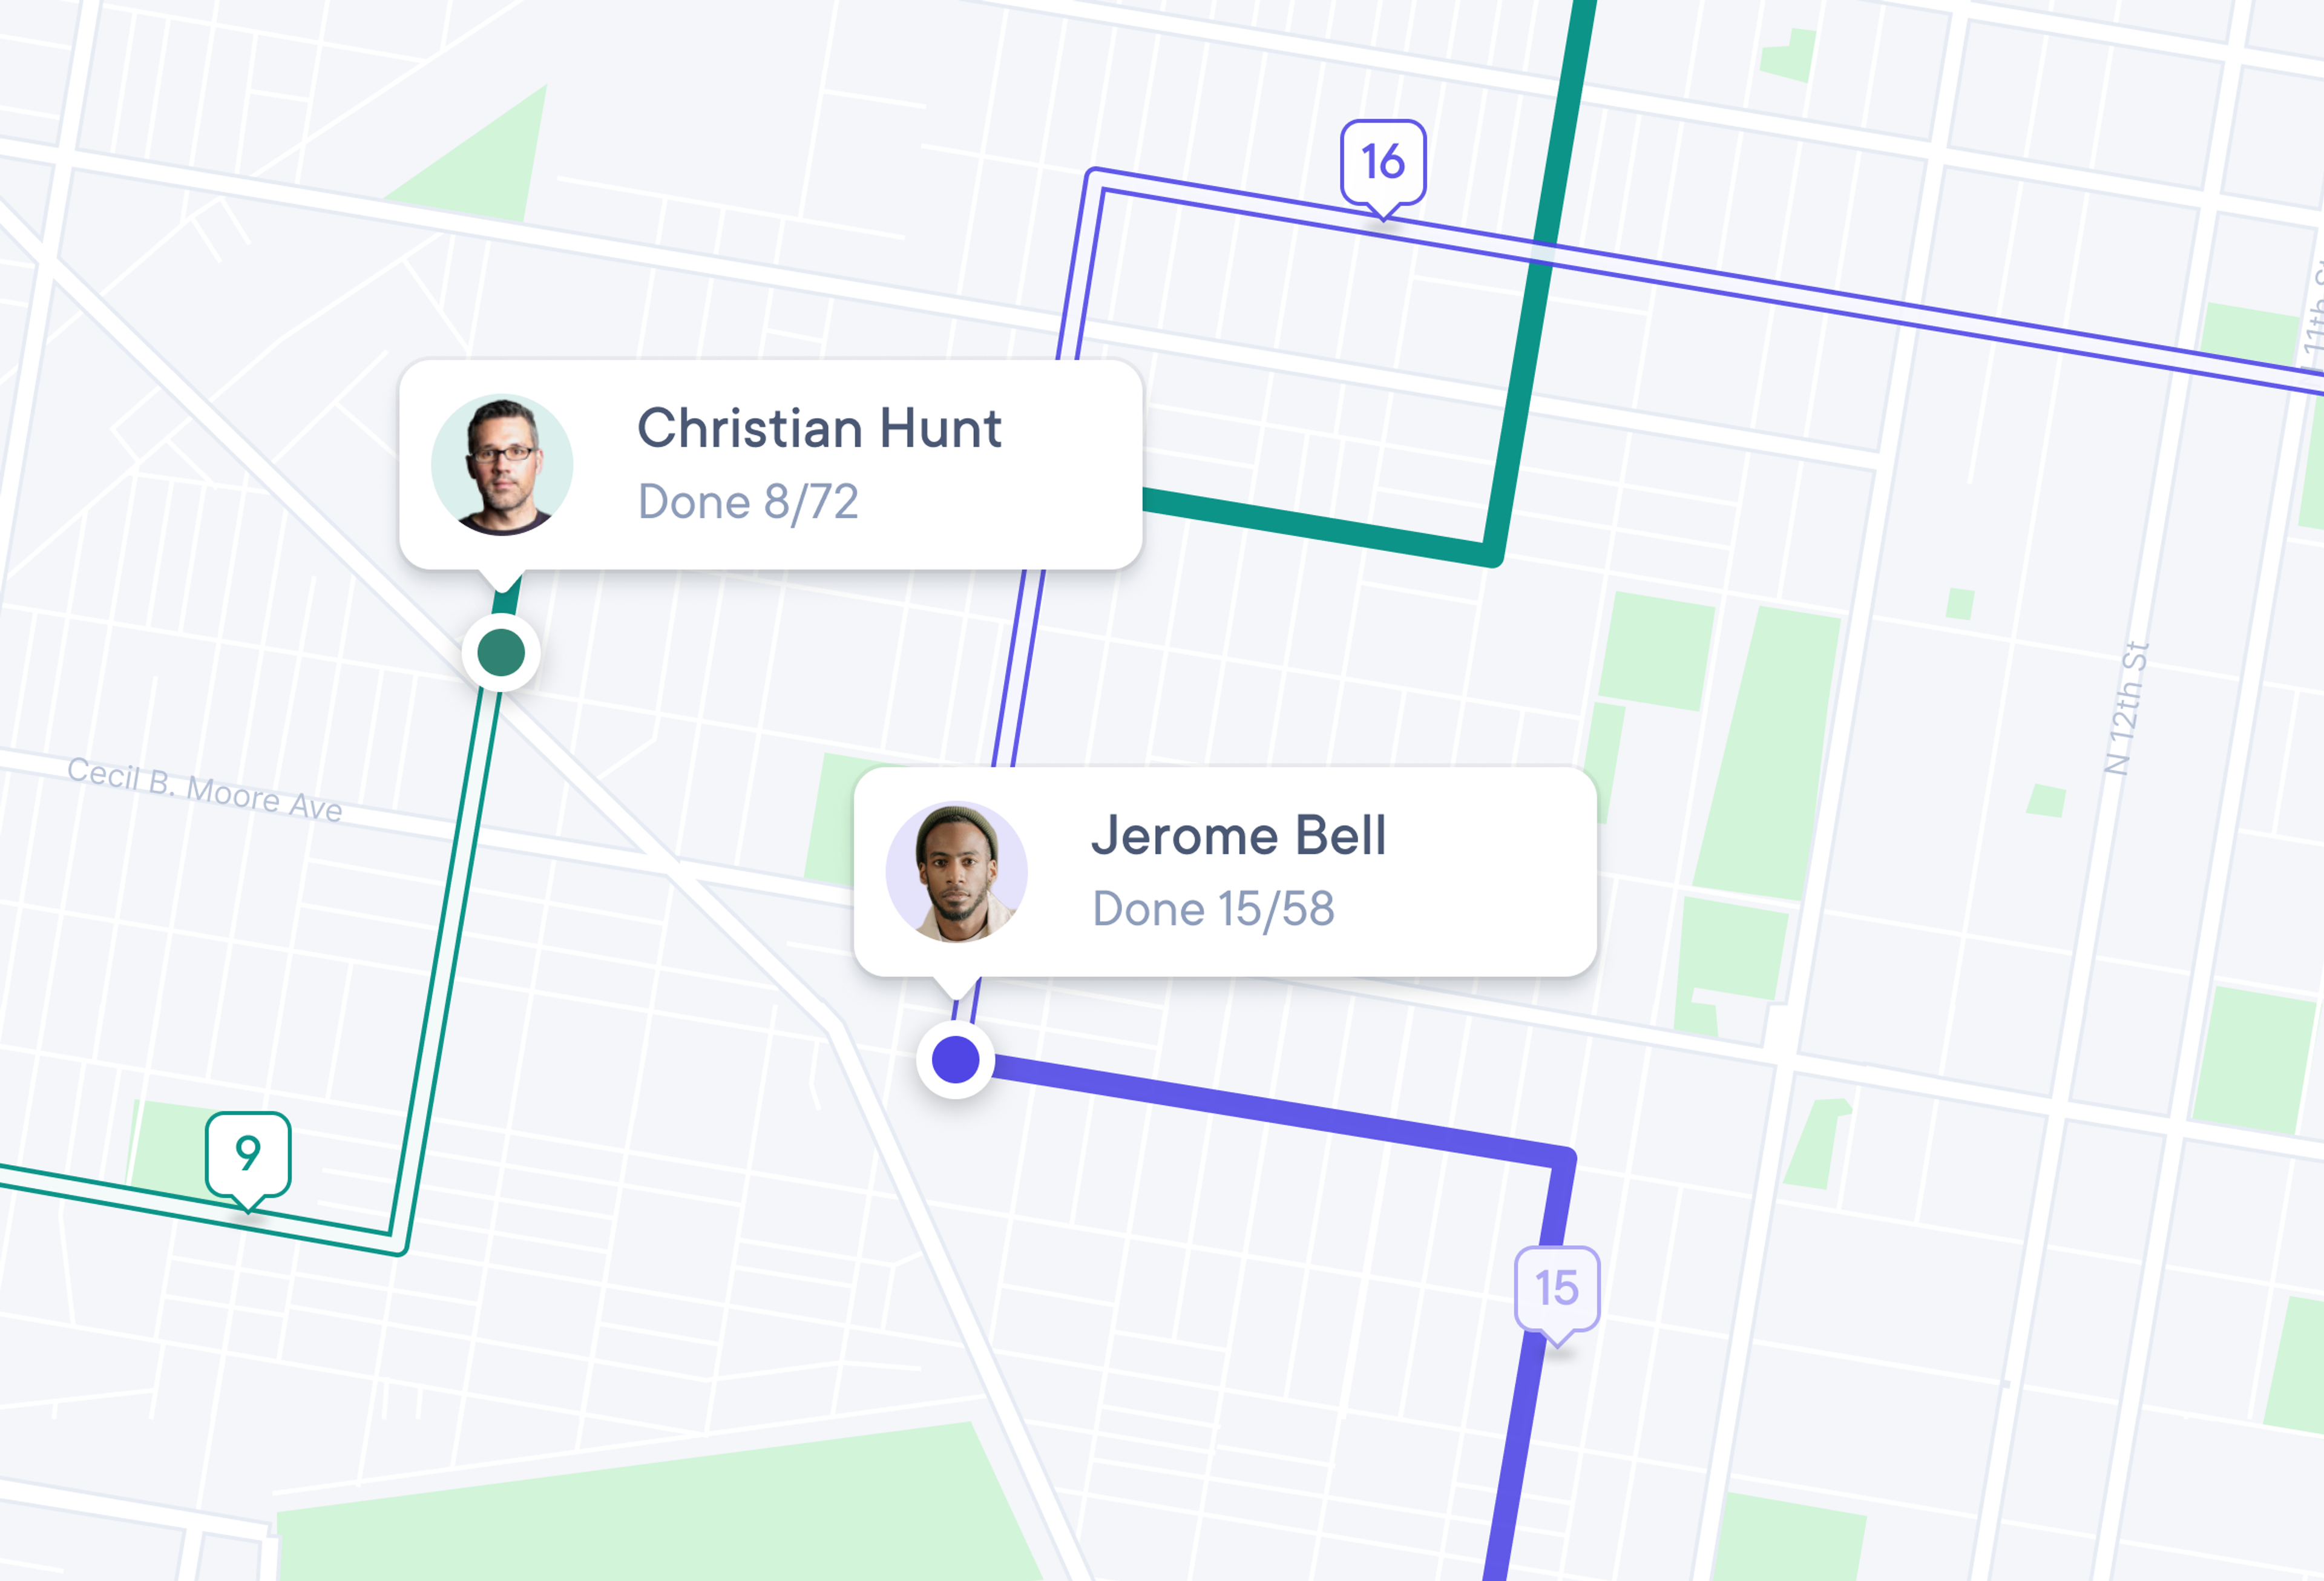
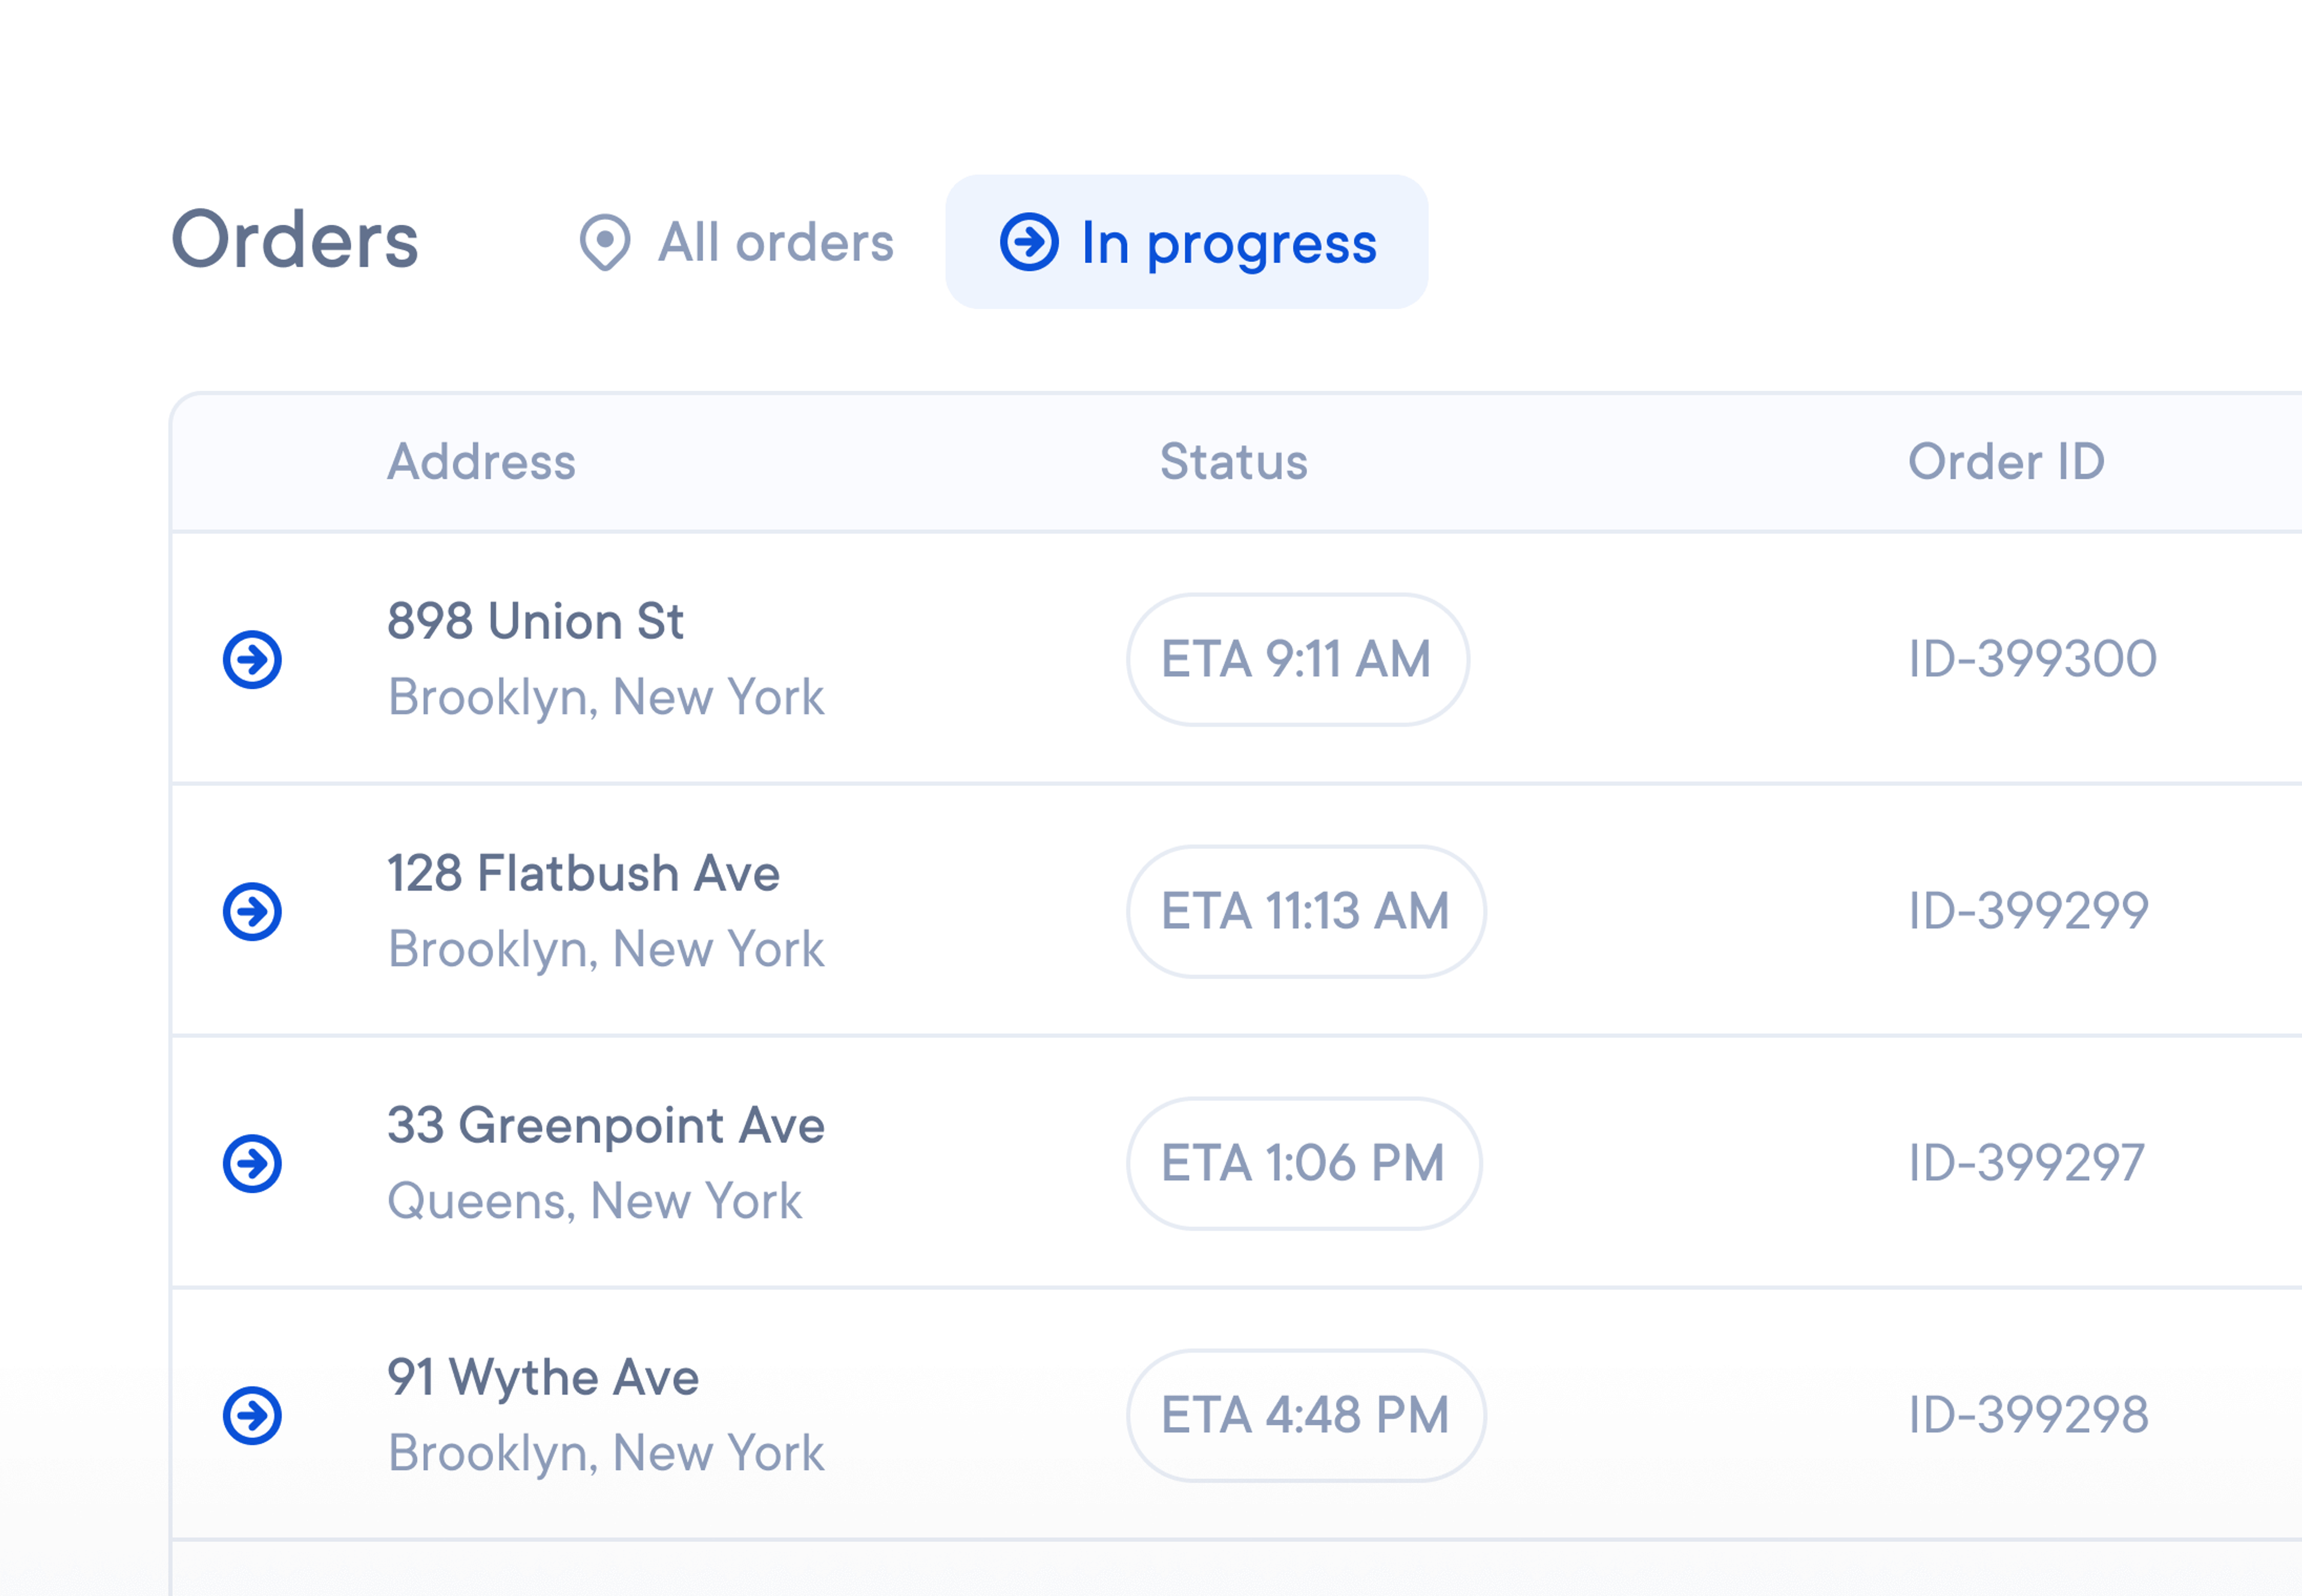
Monitor activity in real time

Live track your drivers and follow progress as it happens. Get a bird’s eye view of all activity, or zoom in for a closer look at a specific driver, route, or stop.

Map view with two colored delivery routes and markers for Christian Hunt (Done 8/72) and Jerome Bell (Done 15/58) at their current stops.

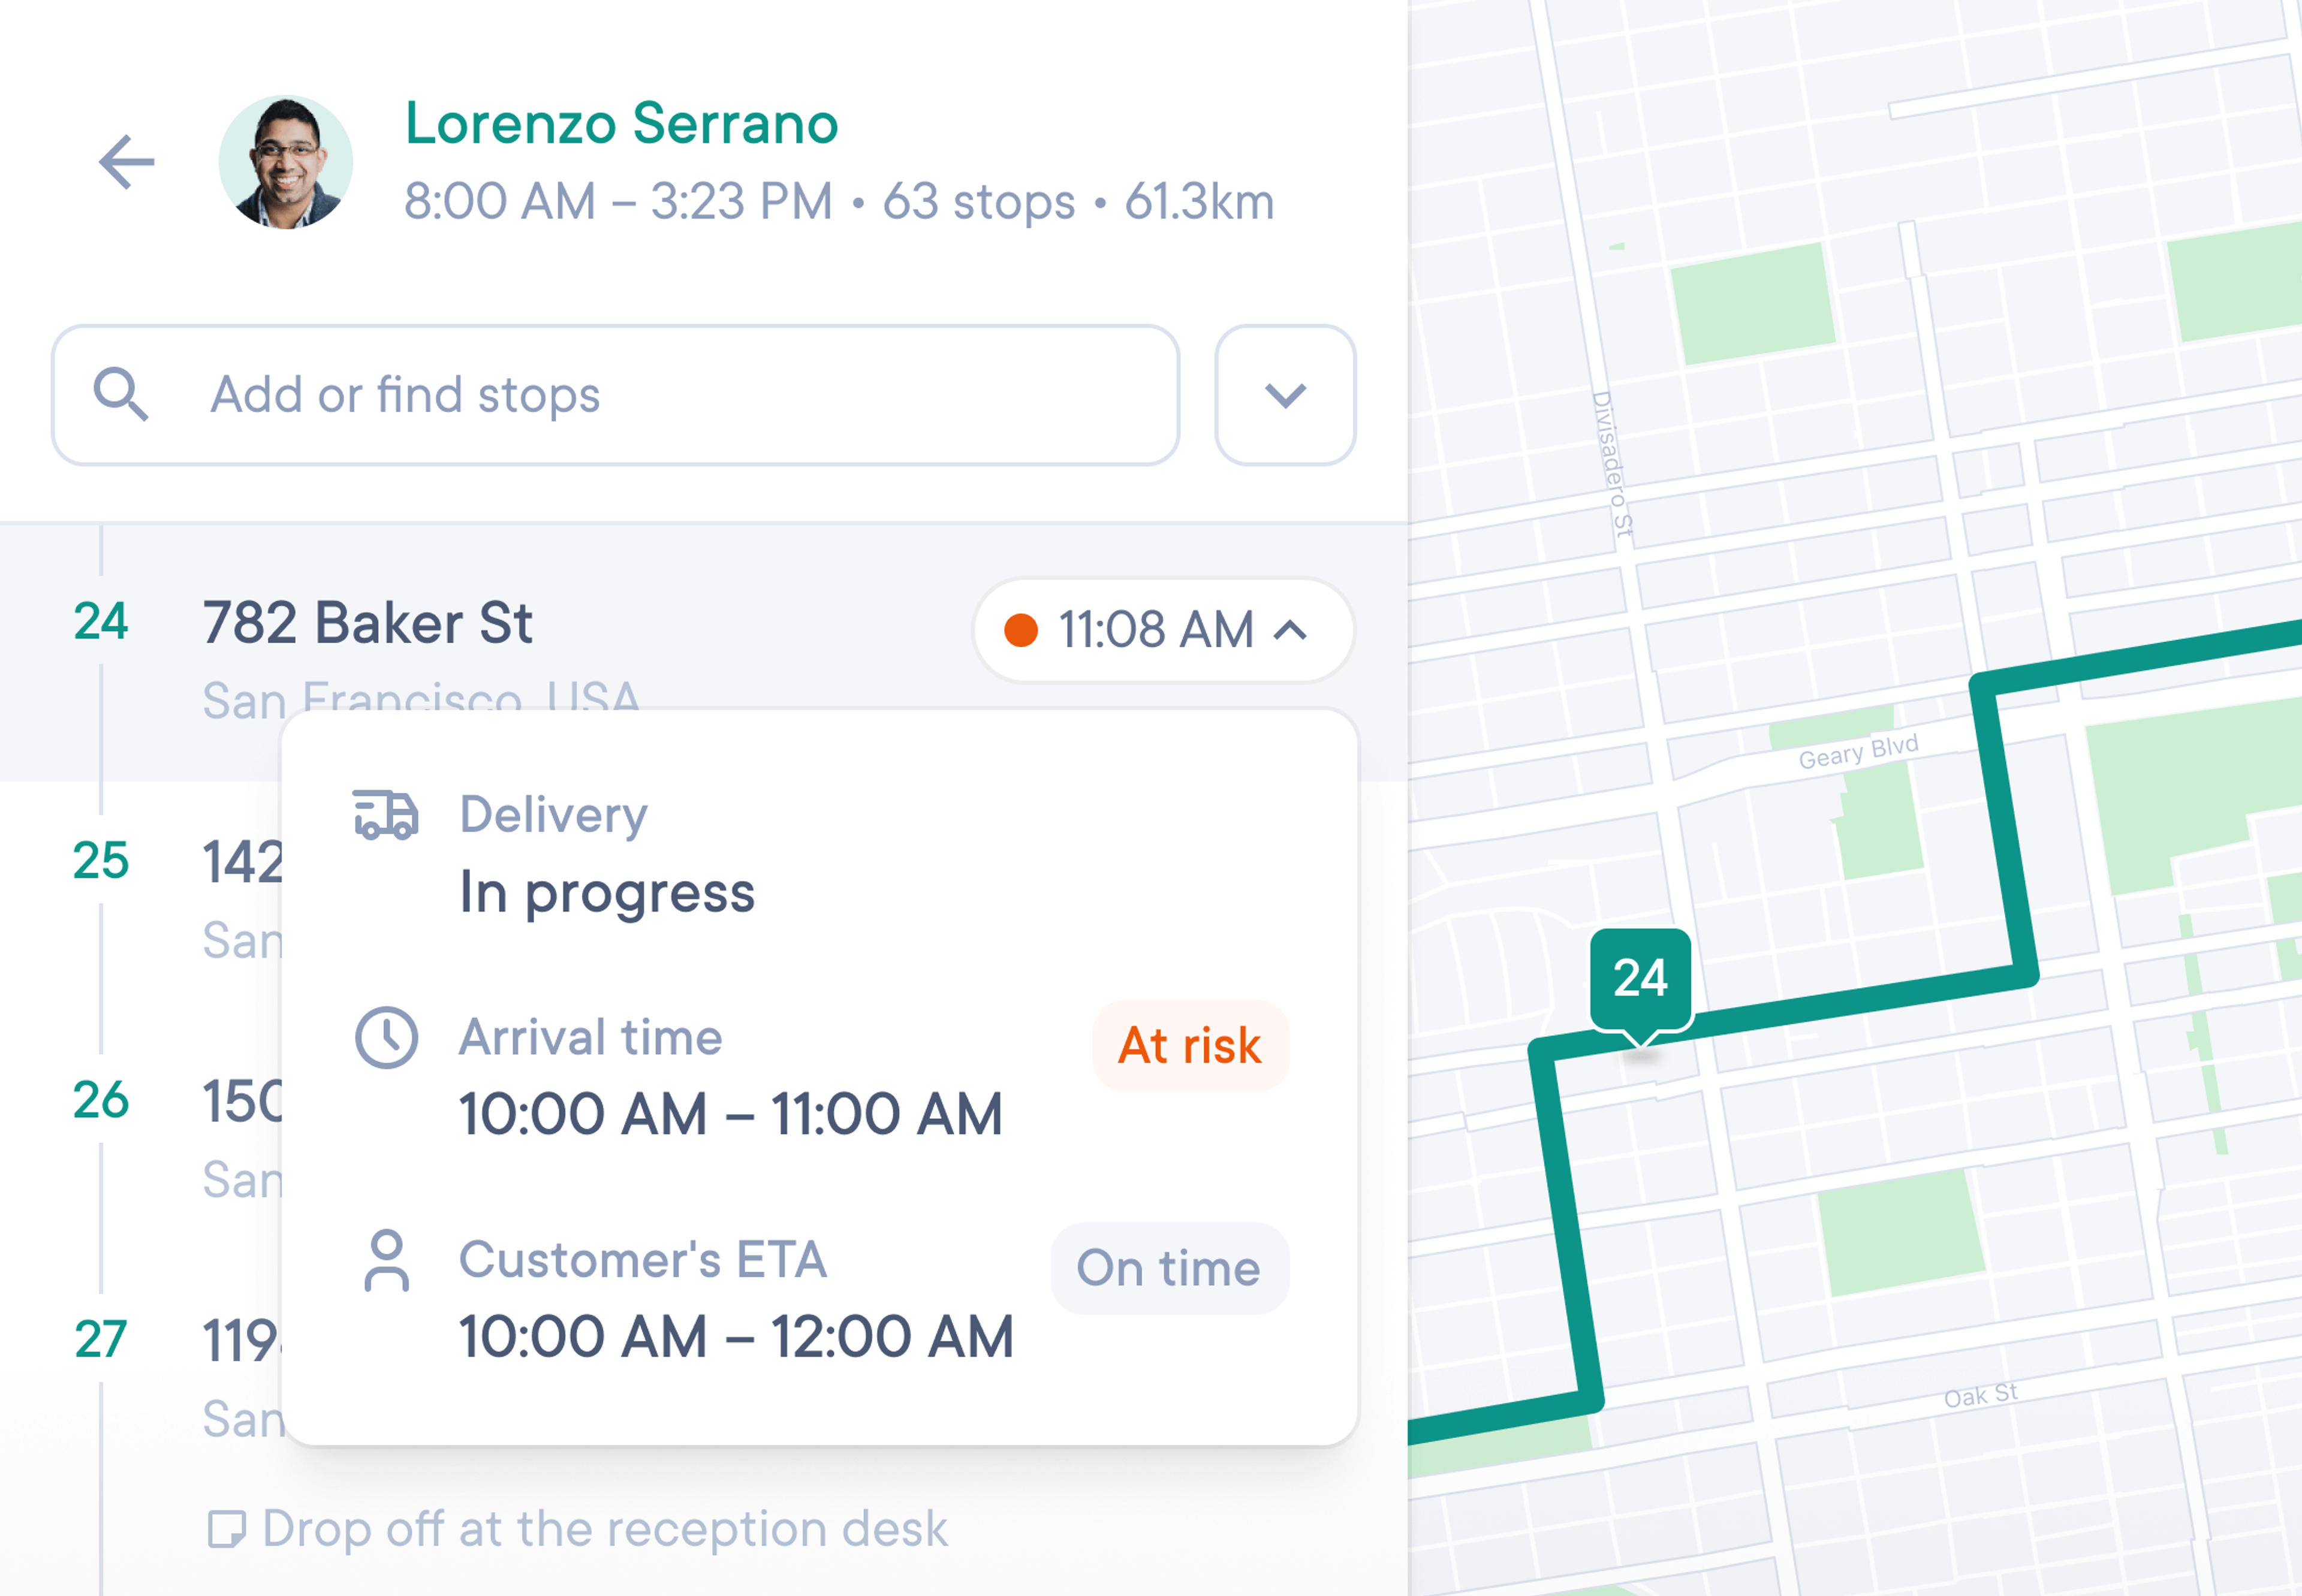
Avoid surprises with dynamic ETAs. Provide up-to-the-minute accurate timings for Dispatchers and Recipients with responsive delivery arrival times.

Driver detail sidebar for Lorenzo Serrano (8 AM–3:23 PM, 63 stops, 61.3 km) with an ‘In progress’ pop-up showing arrival window, risk status, and customer ETA overlaid on his route map.

Provide visibility to clients. Keep your stakeholders in the loop by inviting them to the Client Portal, or granting them read-only account access.

Orders in progress table showing delivery addresses, ETA times, order IDs, recipients, and last updated dates.
Deliver

Simple and secure delivery

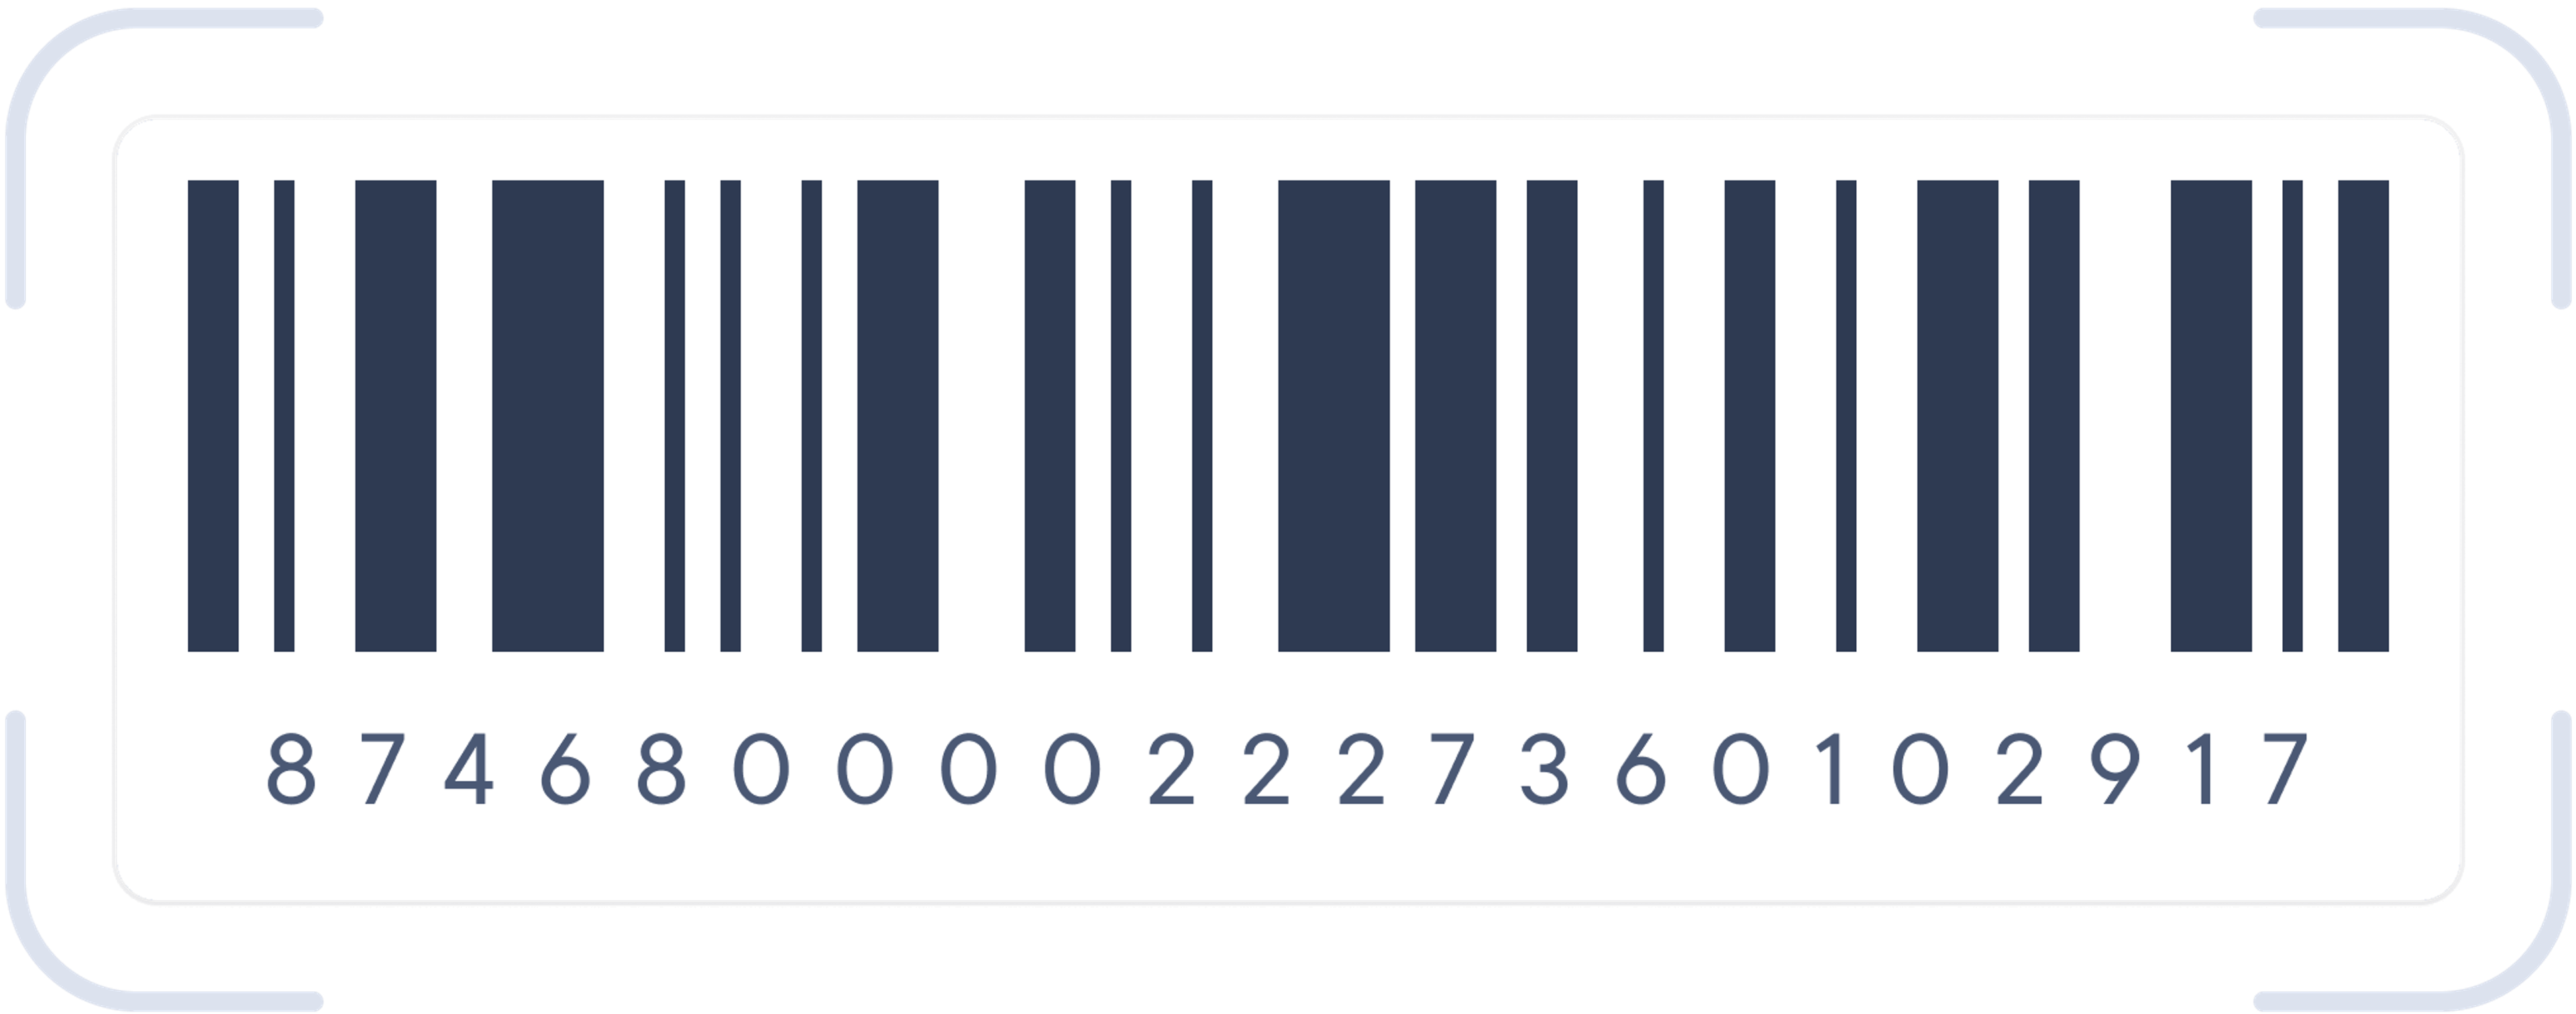
Collect proof of delivery. Scan package barcodes, capture delivery photos, and collect recipient signatures to ensure safe delivery.

  • Capture photos
  • Request signatures
  • Leave in safe place
  • Deliver to neighbor

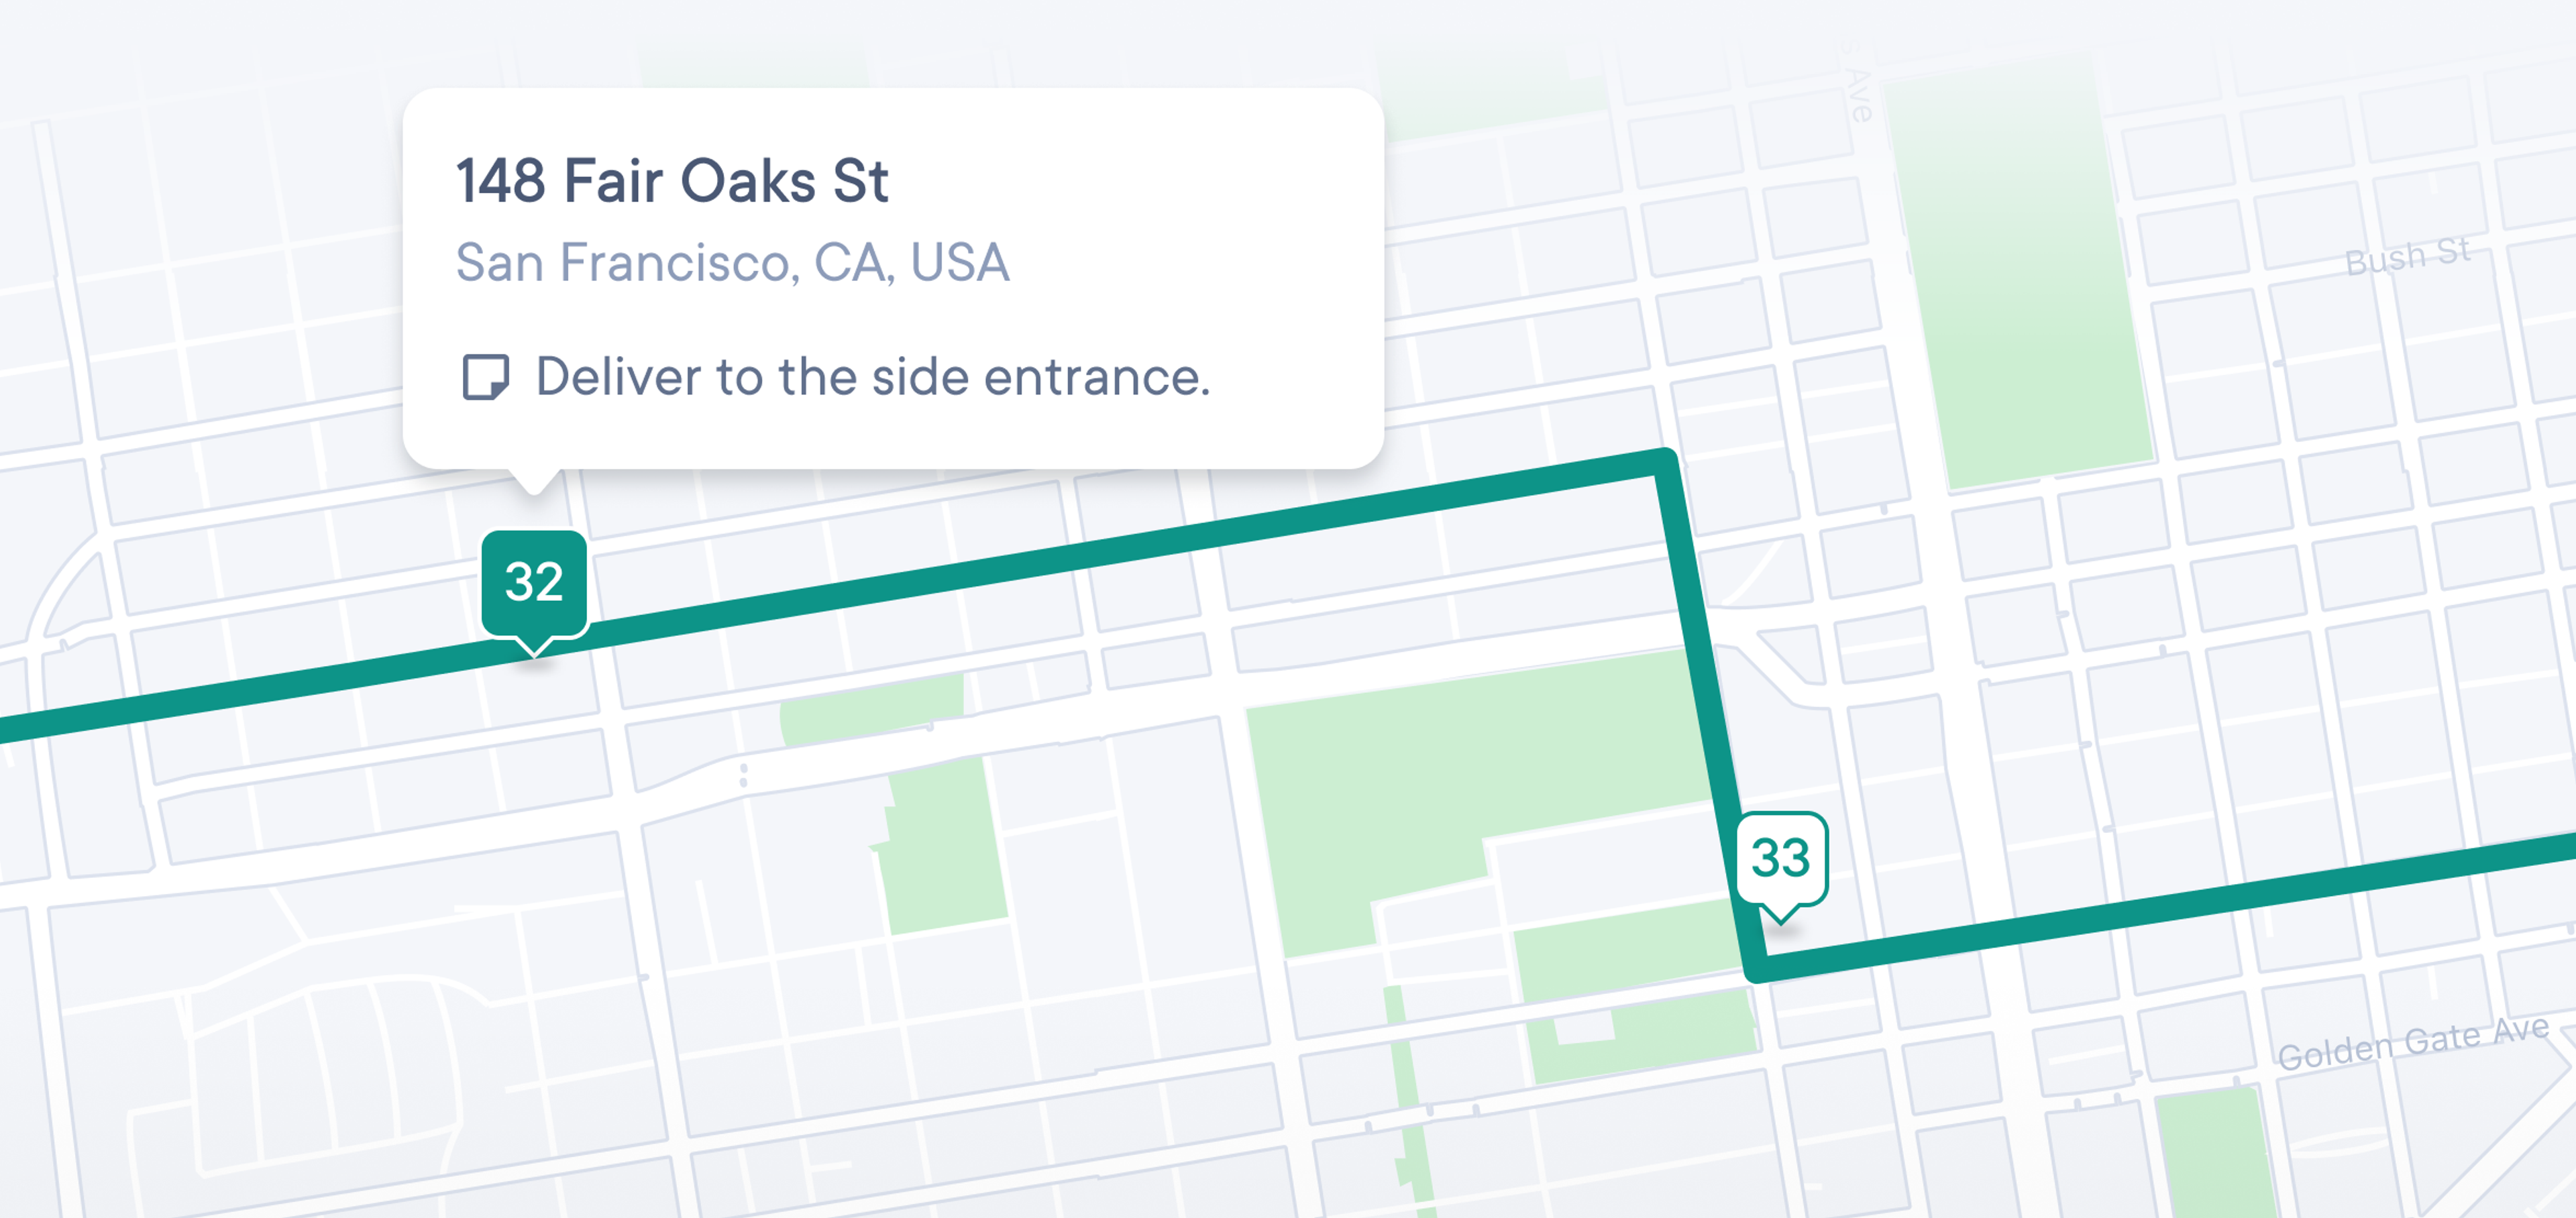
Share stop notes. Drivers and Dispatchers can view and add useful notes to a stop, helping them identify and prevent potential problems.

A light-gray street map segment overlaid with a green delivery route passing stops numbered 32, 33, and 34, and a white pop-up at stop 32 reading “148 Fair Oaks St, San Francisco, CA, USA” with a note icon and the instruction “Deliver to the side entrance.”

Scan barcodes to deliver. Make sure that the right item gets to the correct address by scanning package barcodes on arrival.

A stylized barcode with the number sequence “8746800002227360102917” beneath evenly spaced dark bars.

Provide a 5-star recipient experience. Keep recipients informed and happy with automatic notifications and step-by-step package tracking.

More on recipient experience
A young woman smiling as she holds a large cardboard box in front of a blurred doorway.
Manage

Prevent failed delivery attempts

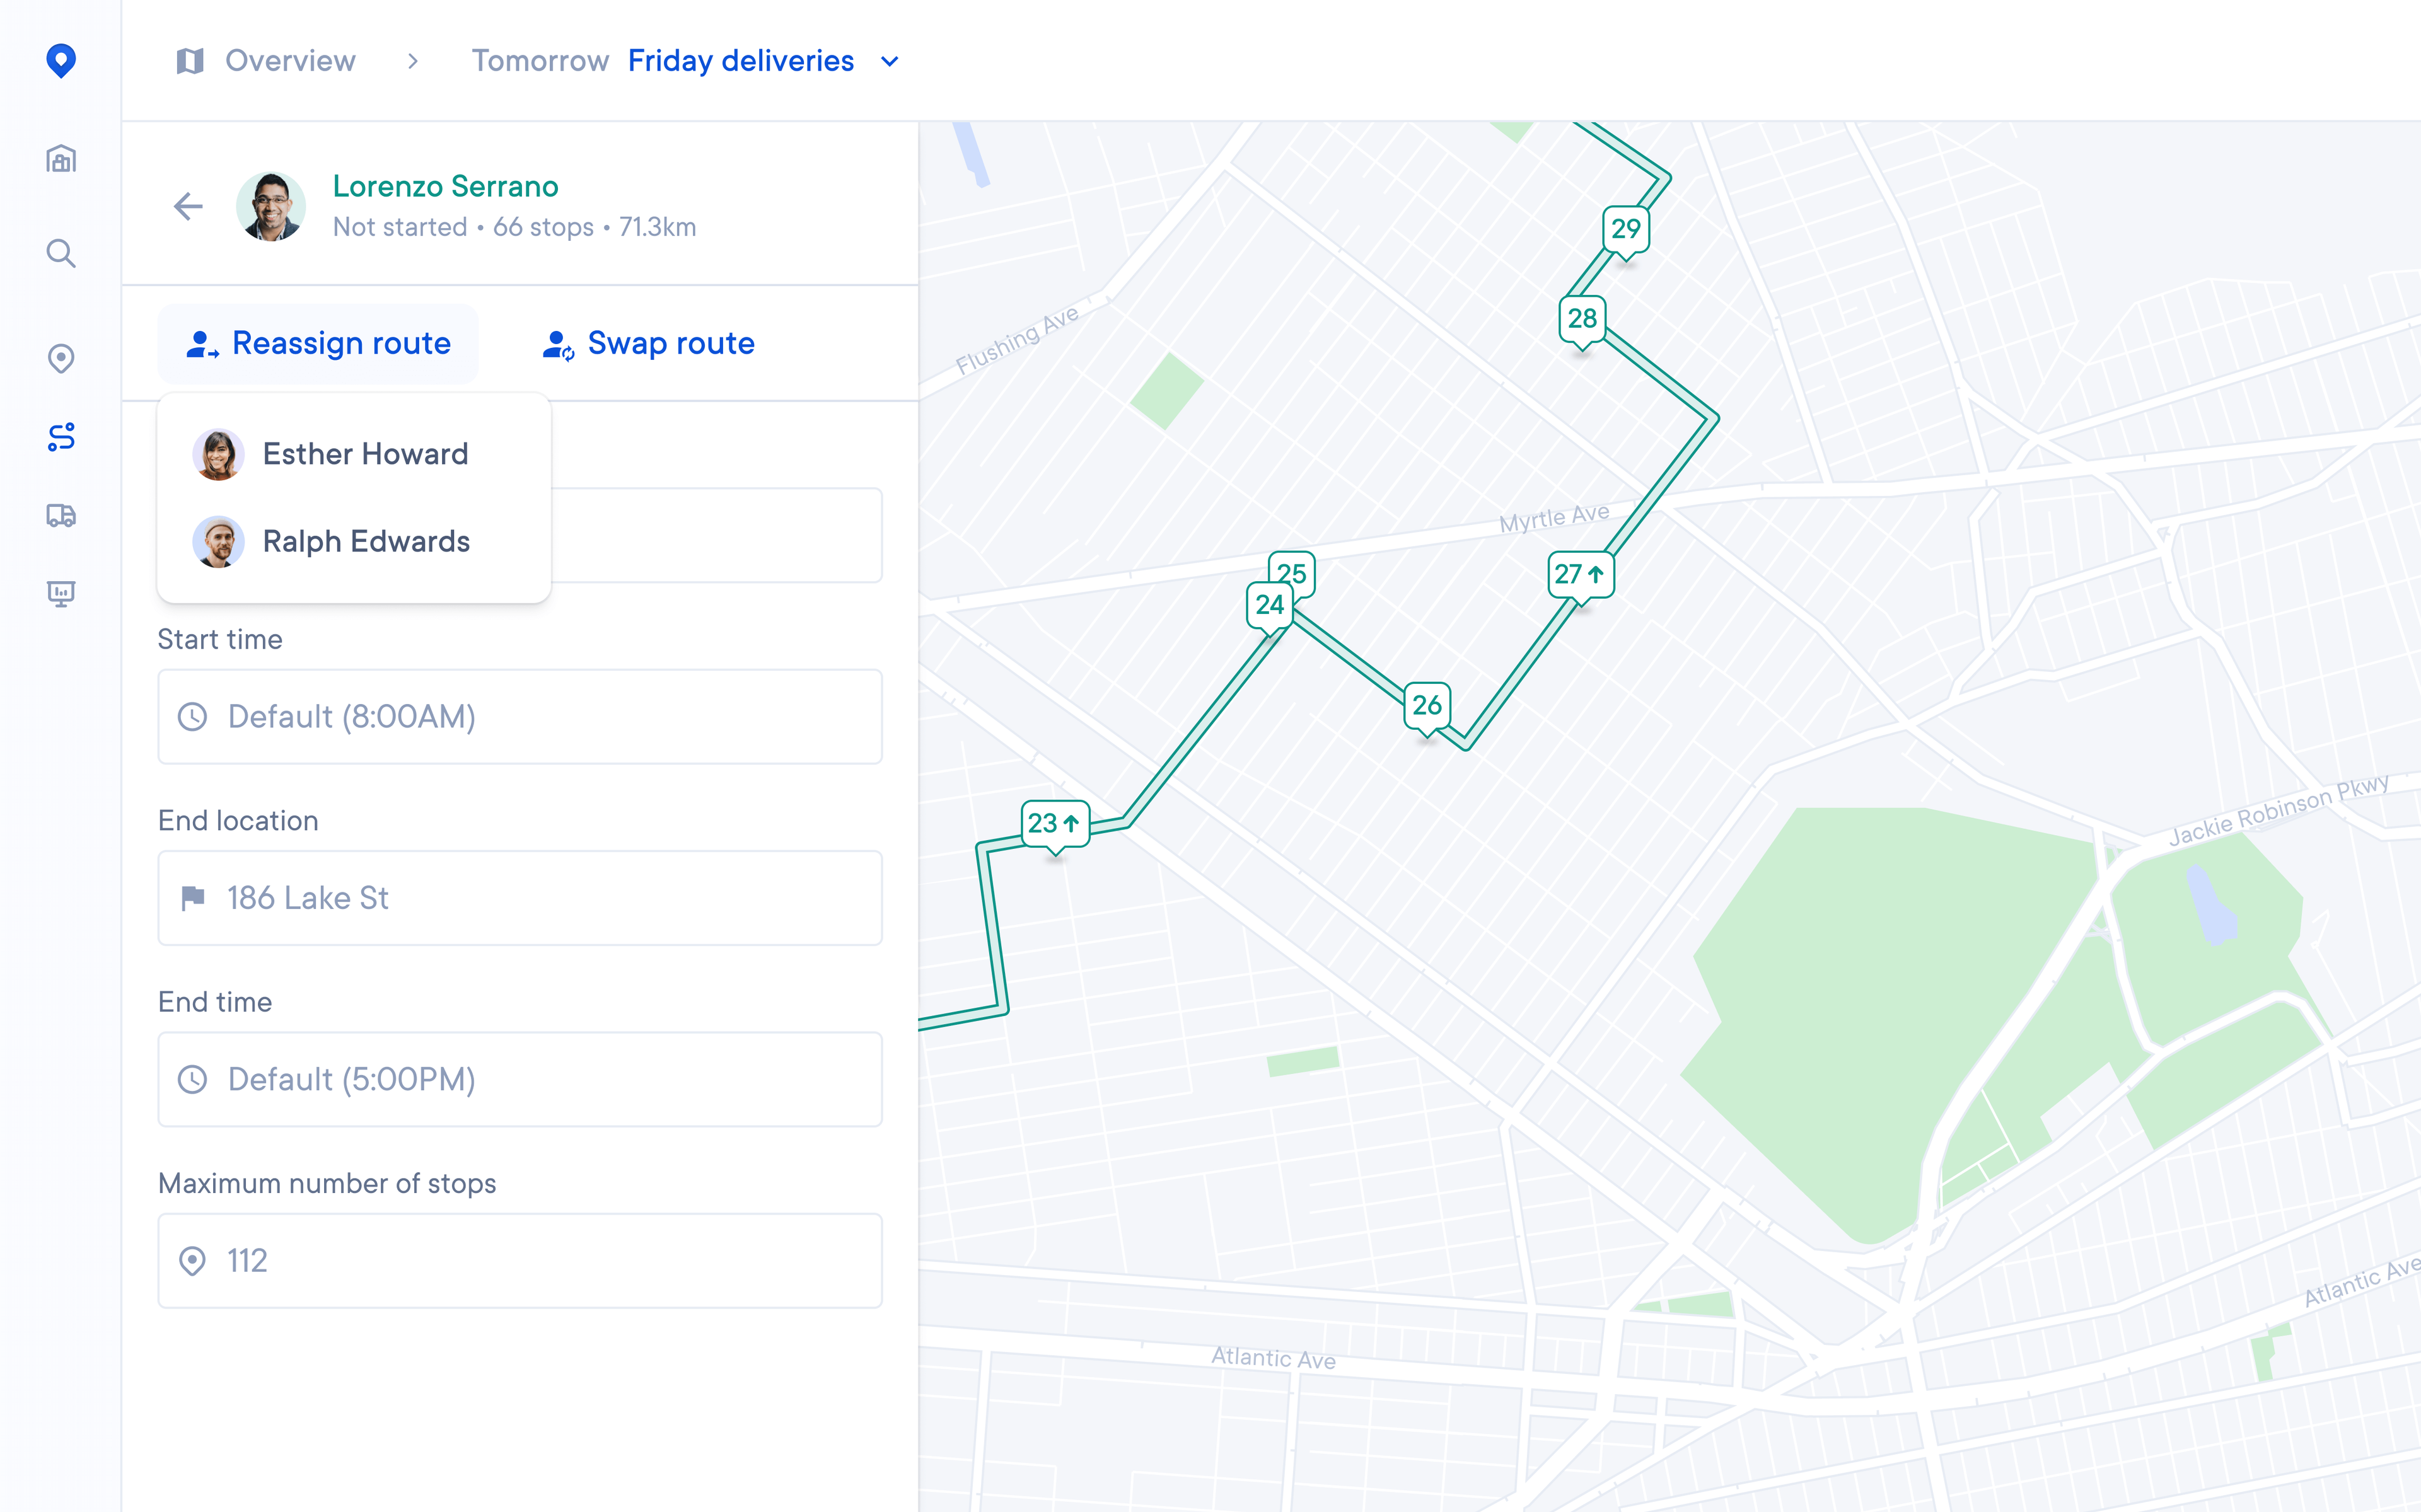
Modify in-flight deliveries. Spot possible issues before they happen, and solve them with minimal disruption to drivers.

  • Reassign stops to available driver
  • Change stops mid-route
  • Factor in re-attempts
A split view for “Tomorrow Friday deliveries” showing on the left a sidebar for driver Lorenzo Serrano (Not started • 66 stops • 71.3 km) with “Reassign route” and “Swap route” buttons listing Esther Howard and Ralph Edwards, plus fields for start time, end location, end time, and max stops; on the right, a green polyline map of stops numbered 23–29.

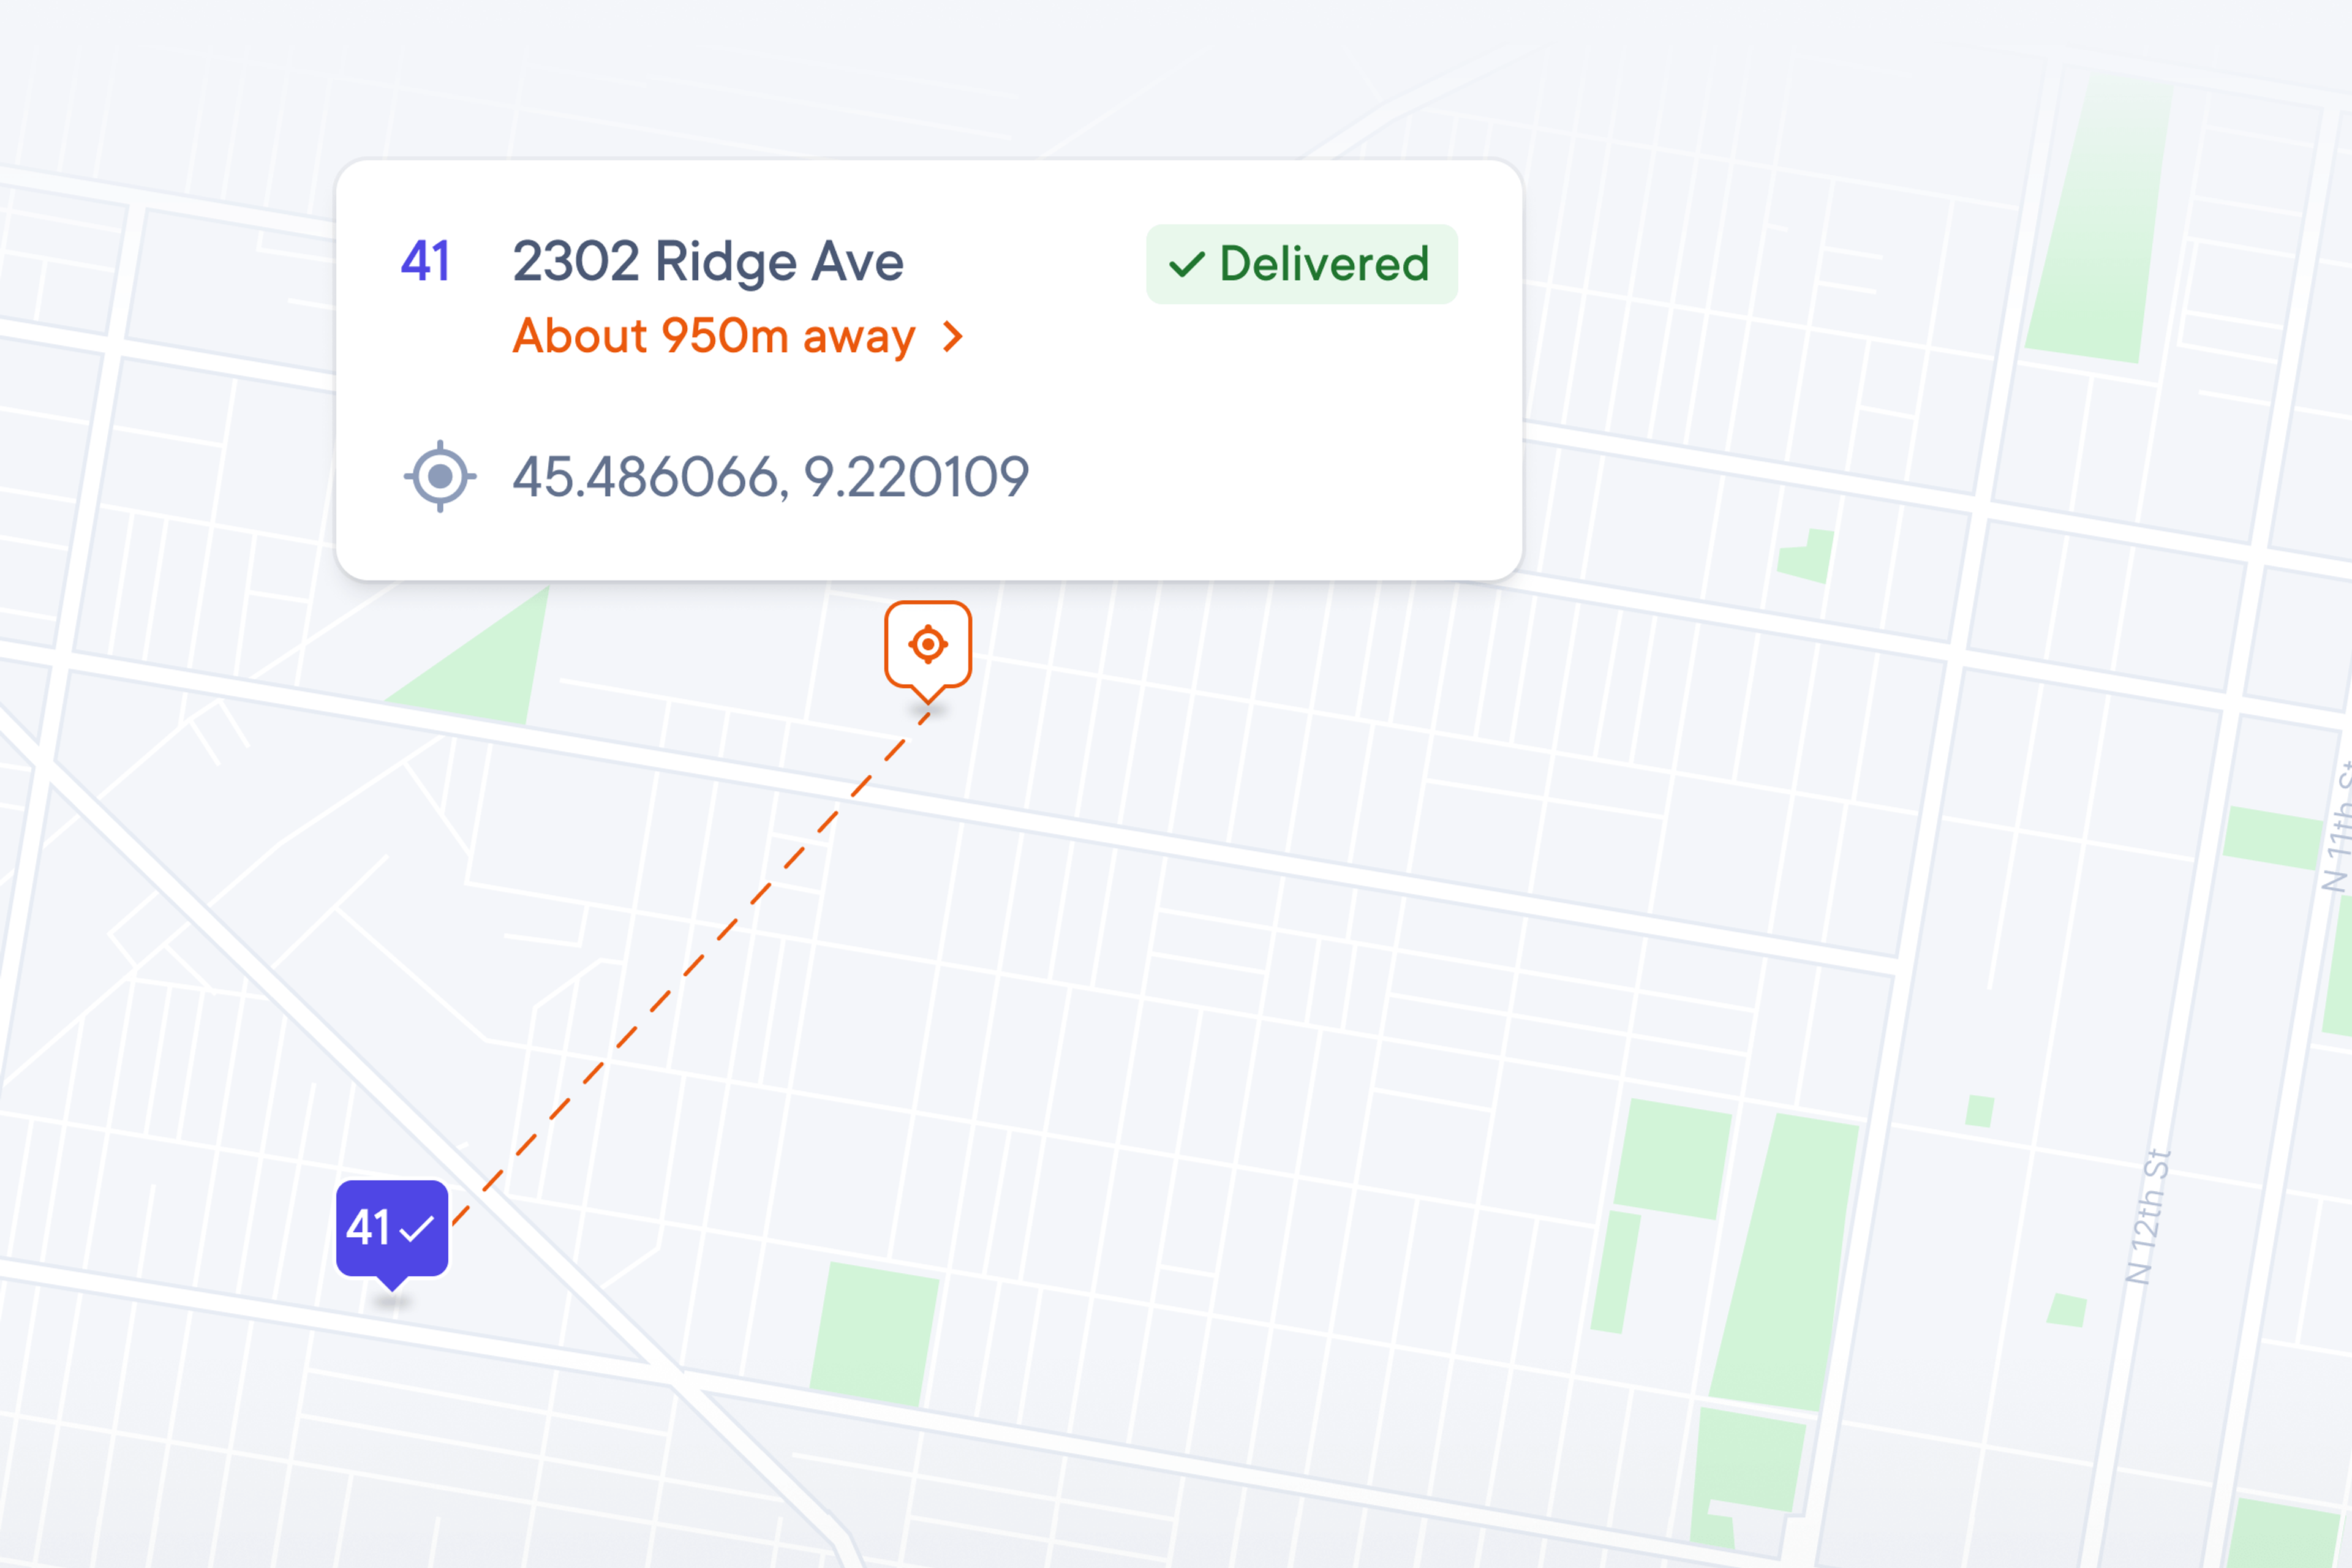
Record precise delivery coordinates. Pinpoint the exact location of packages and recover missing items with GPS-enabled geotags.

A light-gray street map with a purple “41” marker connected by a dashed orange line to an orange target icon; an info box shows “41 2302 Ridge Ave,” “About 950 m away,” GPS coordinates “45.486066, 9.220109,” and a green “Delivered” label.

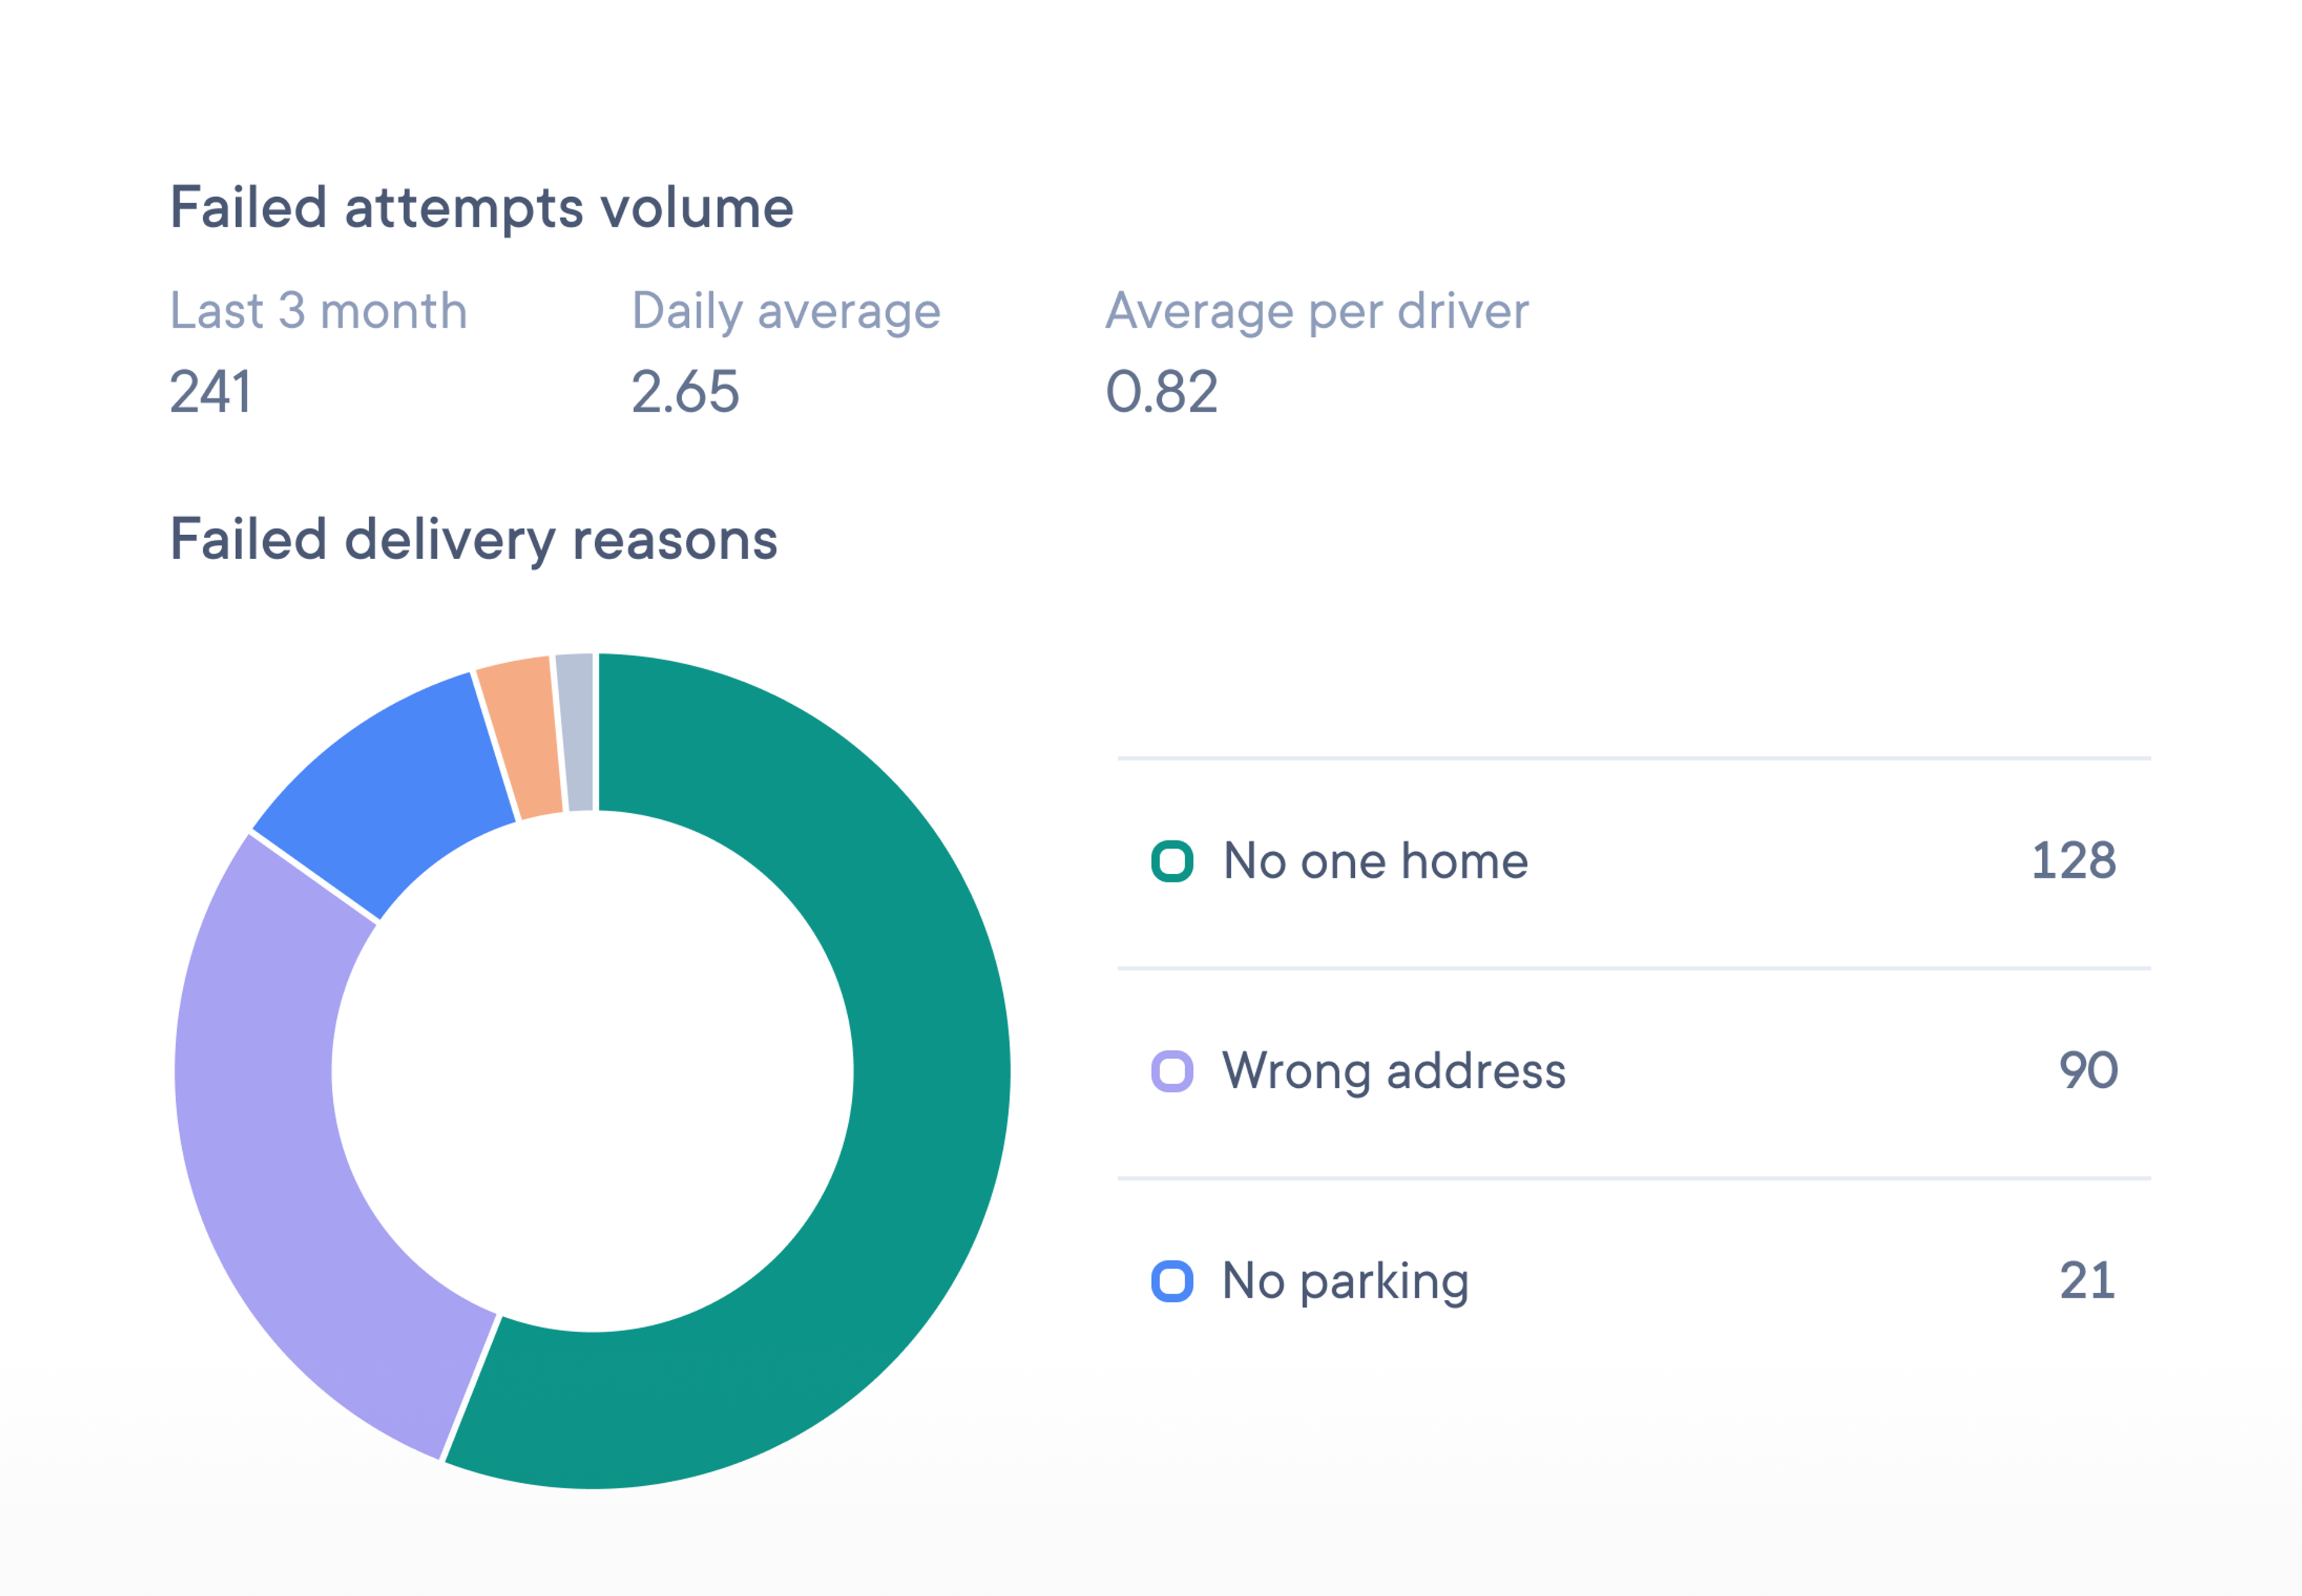
Overcome delivery issues with analytics. Use performance insights to discover the most common reasons for missed deliveries, and to avoid them in the future. Learn more.

A “Failed attempts volume” panel displaying “Last 3 month 241,” “Daily average 2.65,” “Average per driver 0.82,” and a multi-colored donut chart breaking down failure reasons (“No one home 128,” “Wrong address 90,” “No parking 21,” “No time 1”).
A bearded man in a white T-shirt and blue overalls smiling as he carries a large cardboard box down a warehouse aisle lined with tall metal shelving stacked with wrapped pallets and boxes.
4.8 Stars100+ reviews

Powering 2500+ courier companies in 35 countries

Great for route planning and keeping our customers in the loop. I love that our customers can send us an in-flight message when they have to leave unexpectedly, this has been really handy.

JimCompany Owner • UK

Get Started

Last mile management for courier companies