Supply Chain KPIs and Metrics to Measure in 2023

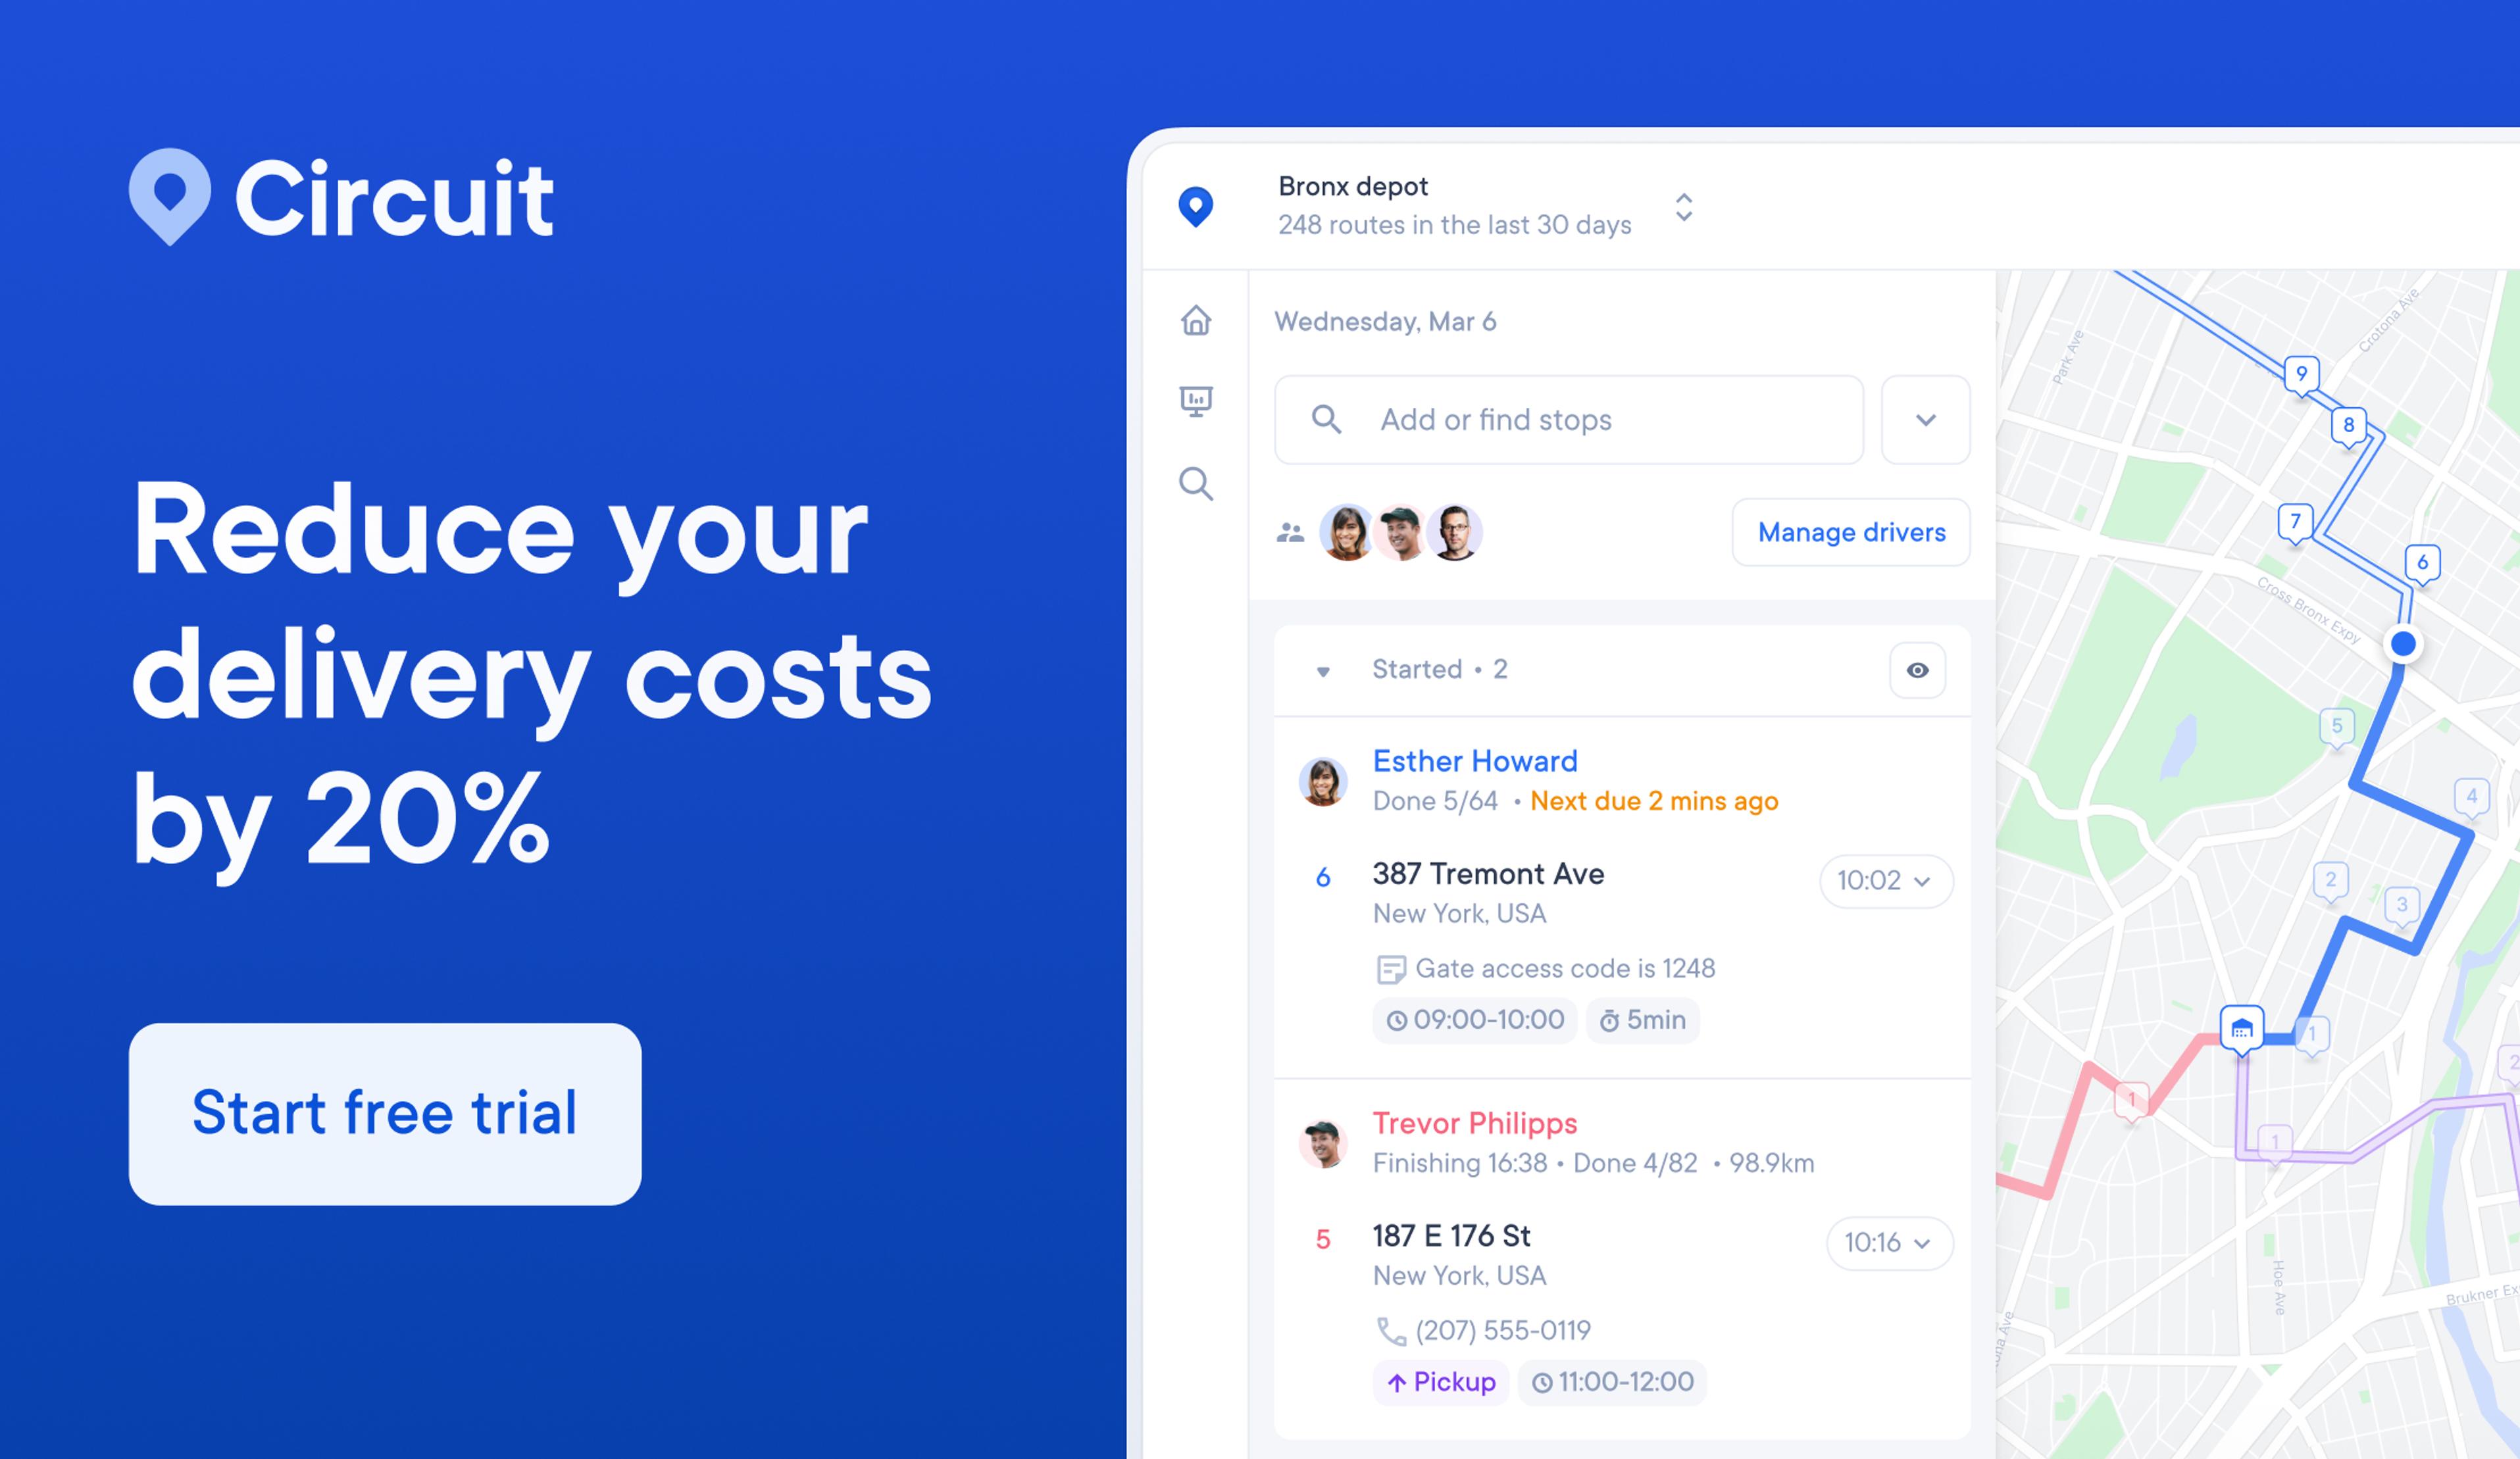
Track delivery performance and improve supply chain KPIs with Circuit for Teams.
Managing your company’s supply chain is one of the most crucial elements to making sure your customers are happy.
If you’re busy dealing with bottlenecks and other supply chain problems, you’re likely to piss off customers — who may look elsewhere for those same products.
Not to mention you could lose money 😡.
To practice supply chain management (SCM) that works and keeps your business running smoothly, you’ll want to keep tabs on a few important supply chain key performance indicators (KPIs).
By tracking supply chain metrics — like your average order fill rate and on-time delivery — you can identify any weak areas in the supply chain.
That big-picture information lets you take action to improve supply chain performance, specifically where metrics don’t meet your desired benchmarks.
Track the right KPIs as they relate to your business, and you’ll have better insight into how you can improve your supply chain processes.
Below, I explain the main KPIs that can help delivery managers like you stay on top of your order fulfillment, inventory, and more.
Top supply chain KPIs to measure
There are many supply chain KPIs to track.
But you’ll want to narrow them down to the metrics that apply to your delivery business and can help you make more money.
Here are some metrics that can help improve customer satisfaction and increase productivity through the supply chain — leading to greater profits in the long term.
1. Cash-to-cash cycle time
Cash-to-cash cycle time — also known as the cash conversion cycle (CCC) — shows you the average time frame it takes your company to convert materials that you purchase from suppliers into cash from completed sales.
You want this time to be as short as possible.
The longer it takes to convert materials into product sales, the longer your cash is tied up in operations.
The exact calculation for cash-to-cash cycle time measures the time between two specific moments — from the moment you pay your supplier for materials to the moment your customer pays for the final product.
Materials Payment Date – Customer Payment Date = Cash-to-Cash Number of Days
The average number of days your company measures for its cash-to-cash cycle time will depend on a few things.
For example, if your delivery company makes customers pay upfront for custom orders, you’ll naturally see a lower value because you got customer payment right away.
There are zero days from the materials payment to the customer payment.
This type of supply chain model can lead to a very low cash-to-cash number — sometimes even a negative number if customers routinely pay you even before you’ve ordered your materials from your supplier!
On the other hand, companies that deal with a lot of raw materials before the job is paid for, such as construction companies, generally have higher cash-to-cash cycles.
For some companies, managing the cash-to-cash cycle time is critical to their success.
For example, Bennett St. Dairy’s raw cookie dough ingredients must sell to customers before they spoil.
2. Perfect order rate
Your perfect order rate allows you to track your delivery performance from your customers’ perspective.
An order is “perfect” when it meets all four of these standards:
- Delivered on time
- Damage-free
- Complete, not partial
- Includes accurate documentation
If a delivery fails to meet even just one standard, the order isn’t perfect.
(Number of Perfect Orders / Total Number of Orders Delivered) x 100 = Perfect Order Rate
The perfect order rate is an expanded, stricter version of another popular delivery KPI called on-time in-full (OTIF).
While OTIF only considers the number of orders delivered on time and complete, the perfect order rate also includes two additional rules — no damages and correct shipping documents.
It might be important to track OTIF if you deliver to customers who demand certain on-time, in-full delivery performance levels.
We also suggest tracking your perfect order rate for a more accurate perspective on how your customers experience your delivery service.
If you have a low perfect order rate due to frequently damaged items, you’re at risk of disappointed customers, higher return rates, and lost profits.
Watching this metric can help you identify the problem and take action to keep packages safer, like training your warehouse management team on better material handling practices.
Or maybe late deliveries have suddenly started bringing down your perfect order rate.
If you’ve been tracking your perfect order rate, you may notice a dip in your on-time delivery performance.
You might address the issue, for example, with a delivery route optimization tool like Circuit for Teams.
For more tips on increasing your perfect order rate, see our post on how to perfect the process of delivering goods to customers.
3. Order fill rate
Your order fill rate tracks how many orders your business can fill from your current inventory.
Successfully filled orders are compared to out-of-stock orders, including:
- Backorders that your customers accept
- Backorders that result in cancellation by customers
- Stockouts where the item is unavailable and you have to cancel the order
Any order that avoids these stocking issues and can be filled out of your inventory without a hiccup is considered a filled order.
The intent behind tracking this metric is to monitor the average number of times your missing inventory leads to a disappointed customer with delays or discontinued products.
When calculating the rate, you’ll probably want to include orders filled by any inventory shipments you received on time to ship out on schedule.
Properly organizing the product on a warehouse shelf before it goes out isn’t really the point when tracking your fill rate.
The point is to track whether you had the product ready to go when you needed to ship it to an expecting customer — without delaying delivery.
(Fulfilled Number of Orders [Total Number of Items - Number of Shipped Items] / Total Number of Orders) x 100 = Fill Rate
The closer to 100%, the better. Still, you don’t necessarily want a perfect fill rate depending on your type of business.
Similar to how a perfect OTIF score might reflect overstocking inventory and tied-up cash, a perfect fill rate shows the same situation.
While it’s awesome for customers if you never have backorders or cancellations, you still have to weigh the costs of potentially investing in too much idle inventory sitting in your warehouse.
And that’s why it’s great to track these important KPIs.
They can give you a big-picture look at how your inventory flows, so you can make changes accordingly.
(Read our posts on calculating your inventory shrinkage and tips on keeping track of your inventory levels.)
Whether there’s an issue with your supply chain efficiency at the supplier level or your procurement staff isn’t ordering enough products to keep up with customer demand, your fill rate offers a great metric to warn you when problems crop up.
For help staying on top of demand, check out our posts on demand forecasting and capacity planning.
4. Customer order cycle time
Whether they know it or not, your customers pay close attention to their order cycle time.
And you should, too.
This metric tells you how much time your company takes to deliver an order to a customer — from the time they place their order to the time it arrives at their home and delivery is marked complete.
Customer order cycle time is usually measured in the number of days from purchase to delivery, including weekends and holidays.
However, if you routinely complete on-demand, same-day deliveries (like a marijuana delivery service, for example), you might use the number of hours or minutes instead of days.
Whatever your business model, this order performance measurement is meant to reflect the customer’s overall wait time for their order.
Delivery Date – Customer Order Date = Days (or Hours) of Order Cycle Time
Whether your average time adds up to months or just 30 minutes, your ability to track your supply chain’s customer order cycle time can help you meet customer expectations and delivery guarantees — while remaining competitive in your industry.

5. Inventory days of supply
Your inventory is the lifeblood of your supply chain — and it needs to keep flowing to keep your business alive and well.
That’s where your inventory days of supply can help you.
This term — often known more simply as “days in inventory” — measures how much time, on average, your inventory sits on your shelf and takes to sell.
The calculation starts from the moment your company purchases raw materials or products from your supplier to the moment a customer purchases that inventory.
(Inventory / Cost of Sales) x (Days in Period) = DSI
Tracking this metric can help you manage your supply chain in a few ways.
First, it shows how quickly your company can sell products.
Second, it can help your warehousing management maintain ideal inventory levels based on your sales pace.
If you have a low number of days in inventory — meaning your stock sells fast — you might change how much inventory you buy at once, so you don’t risk running out at peak demand times.
On the other hand, if your number of days in inventory is high because sales are slower, you might not order too much inventory — so you can minimize the amount of cash you have tied up in idle products.
6. Freight bill accuracy
Freight bill accuracy measures how often your company receives a shipping invoice that doesn’t match the original quote your supplier said they would charge you.
Unfortunately, inaccurate invoices for shipments are common enough that an entire industry has been built around freight invoice auditing.
There’s a wide range of bill auditing companies, automation tools, and software programs that help people on all sides of the process improve billing accuracy, keep track of inaccuracies, and reduce transportation costs in their logistics operations.
The cost of your supply chain operations can get out of hand if shippers are constantly overcharging you.
But you can use a simple KPI to start monitoring the freight bill accuracy at your own company.
It’s important to audit invoices regularly so you can correct any errors or reject inaccurate invoices that fall well below your standards.
This means comparing the original quotes your shippers gave you to the final invoices they charged.
Once you have that number — the number of invoices that matched the original quote — you can run this calculation:
(Number of Accurate Freight Bills / Total Freight Bills) x 100 = Freight Bill Accuracy Rate
You’ll want your accuracy percentage to be as high as possible — ideally 100%.
If it’s not, keep in mind that mistakes are being made that could cost you money.
Don’t let your supply chain costs increase because of mistakes by your suppliers.
Shippers who just can’t get a bill right might need to be ousted for a better business partner.
7. Inventory turnover ratio
Regularly calculating your inventory turnover ratio can help you keep a good balance between overstocking and running out of products.
This useful KPI for inventory management — also known as the inventory-to-sales ratio — measures how fast your inventory sells after you purchase it.
While it’s similar to the inventory days of supply, the inventory turnover ratio gives you a simple percentage to track along with the average number of days of supply.
The ratio is a nice indicator on a 0-to-100 scale that’s easy to track over time.
Cost of Goods Sold (COGS) / Average Inventory = Inventory Turnover Ratio
Our post on how to calculate the inventory turnover ratio details finding these numbers for your business.
If you regularly watch for changes in your turnover performance, you can take action when the metric fluctuates.
For example, if inventory starts selling more slowly, you can consider ways to get it moving, like offering discounts or investing in marketing for slow movers.
8. Days sales outstanding (DSO)
This KPI tracks how many days, on average, it takes your customers to pay their invoices.
If your business often charges customers for purchase orders (POs) through invoices or bills that don’t have to be paid upfront, it’s important to monitor your days sales outstanding (DSO) average.
(Total Outstanding Invoices / Total Invoice Sales) x Number of Days = DSO Rate
Your DSO plays a critical role in your cash flow.
A high DSO can indicate that your business is headed toward a cash crunch.
If you’re having problems with a certain customer paying you, for example, your DSO can alert you to the magnitude of the issue.
You might consider that it’s time to stop chasing payments from them and fire them as a customer altogether.
Or take a less drastic approach and ask them to renegotiate your payment terms.

Deliver orders faster and easier with Circuit for Teams
Tracking metrics is one thing, but gathering the right data — and making business adjustments — is another story.
Do you need help tracking whether your company completes deliveries on time or late?
Circuit for Teams can help.
Trying to improve your perfect order metrics?
Use Circuit for Teams to optimize your delivery schedules and get orders to customers on time more consistently.
These are just a few ways the Circuit for Teams delivery app helps business owners boost their supply chain operations.